Viewing Tool
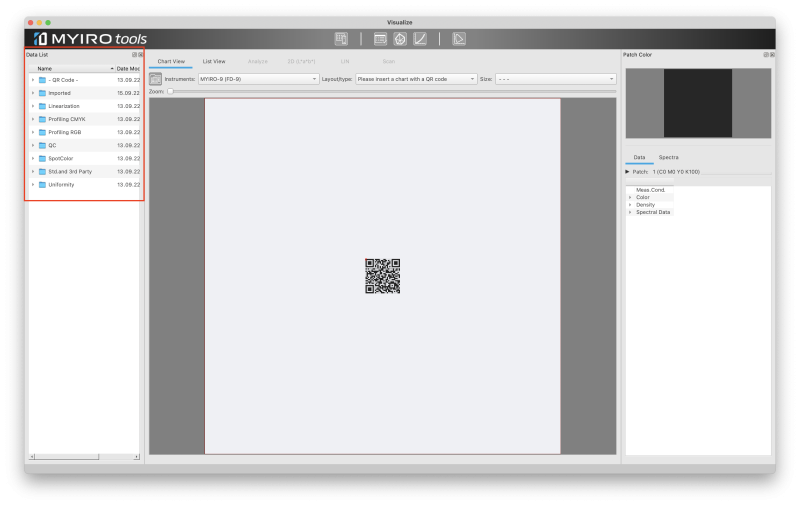
The tool "View" is the central tool to look at color management charts and measurement data.
It is divided into three main parts. Please refer to the pertinent tabs for details.
- Data List
- Main window
- Patch Color
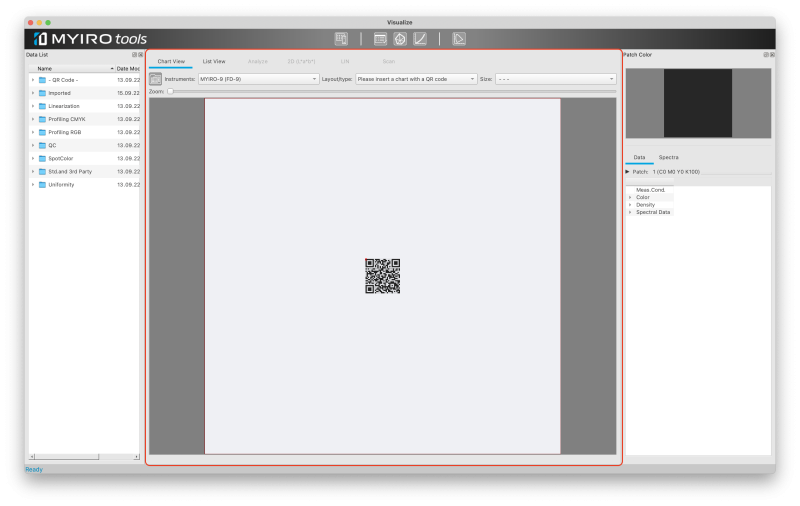
Select this folder to measure a sample which contains a QR code for MYIRO-9
This folder contains the chart definitions which have been imported using File - Import Chart
This folder contains two groups of charts for linearization
- Compose (Charts that are used with Compose RIPs)
- G7 Linearization
- P2P51
- TC1617
This folder contains three charts:
- CMYK-420
- CMYK-840
- CMYK-2520
This folder contains nine charts:
- CMYK OGV
- CMYK OG
- CMYK OV
- CMYK GV
- CMYK O
- CMYK G
- CMYK V
- CMY
- ECG CMYKOGV v1a
This folder contains three charts:
- RGB-420
- RGB-840
- RGB-2520
This folder contains five charts:
- FOGRA MediaWedge V3.0
- FOGRA MediaWedge RGB
- IDEAlliance ISO 12647-7 Control Wedge 2013
- JapanColor Control Strip
- JMPA Color 2018 Control Strip
This folder contains several definitions of charts which are commonly used in the printing industry.
Depending on the layout you cannot measure them with every instrument.
The print files are not included in the MYIROtools installation package.
- ECI2002
- GMG Flexo-Chart V2
- IDEAlliance P2P51
- IDEAlliance TC1671
- IT8/7.4
Click here to view Easy Uniformity manual section
The charts in this folder can be measured with a strip or chartreader:
- 3 charts for profiling 5 color processes
- CMYKO
- Can be used with Orange or Red as gamut expanding ink
- CMYKG
- Can be used with Green
- CMYKV
- Can be used with Violet or Blue as gamut expanding ink
- Can be used with Violet or Blue as gamut expanding ink
- CMYKO
- 3 charts for profiling 6 color processes
- CMYKOG
- Can be used with Orange or Red plus Green as gamut expanding inks
- CMYKOV
- Can be used with Orange or Red plus Violet or Blue as gamut expanding inks
- CMYGV
- Can be used with Green plus Violet or Blue as gamut expanding inks
- Can be used with Green plus Violet or Blue as gamut expanding inks
- CMYKOG
- 2 charts for 7 color processes
- CMYKOGV
- The recommended chart to be used for the MYIROtools Profiler
- IDEAlliance ECG Chart
- This chart can not be measured with a MYIRO-1 and its standard ruler.
Please use the MYIRO-9 to measure this chart.
- This chart can not be measured with a MYIRO-1 and its standard ruler.
- CMYKOGV
These different viewing modes can be changed by clicking on "Chart View", "List View", "Analyze" and "Scan".
Depending on the selection in the "Data List" different instances of a chart can be selected at the top of the window.
The available switches are
- Instruments
- Layout/type
- Size
In case a chart has more than one page arrows to switch between the pages or toggle a complete overview is activated.
If a patch is selected by clicking on it, the window "Patch Color" shows the details of the selected patch.
If a measurement file is selected from the "Data List", all patches show a preview of the measured value (center) as well as a preview calculated from the device value (border) of the chart. In case the border of a patch shows a huge color difference compared to the center (e.g. green instead of red) it is likely that a measurement error occured.
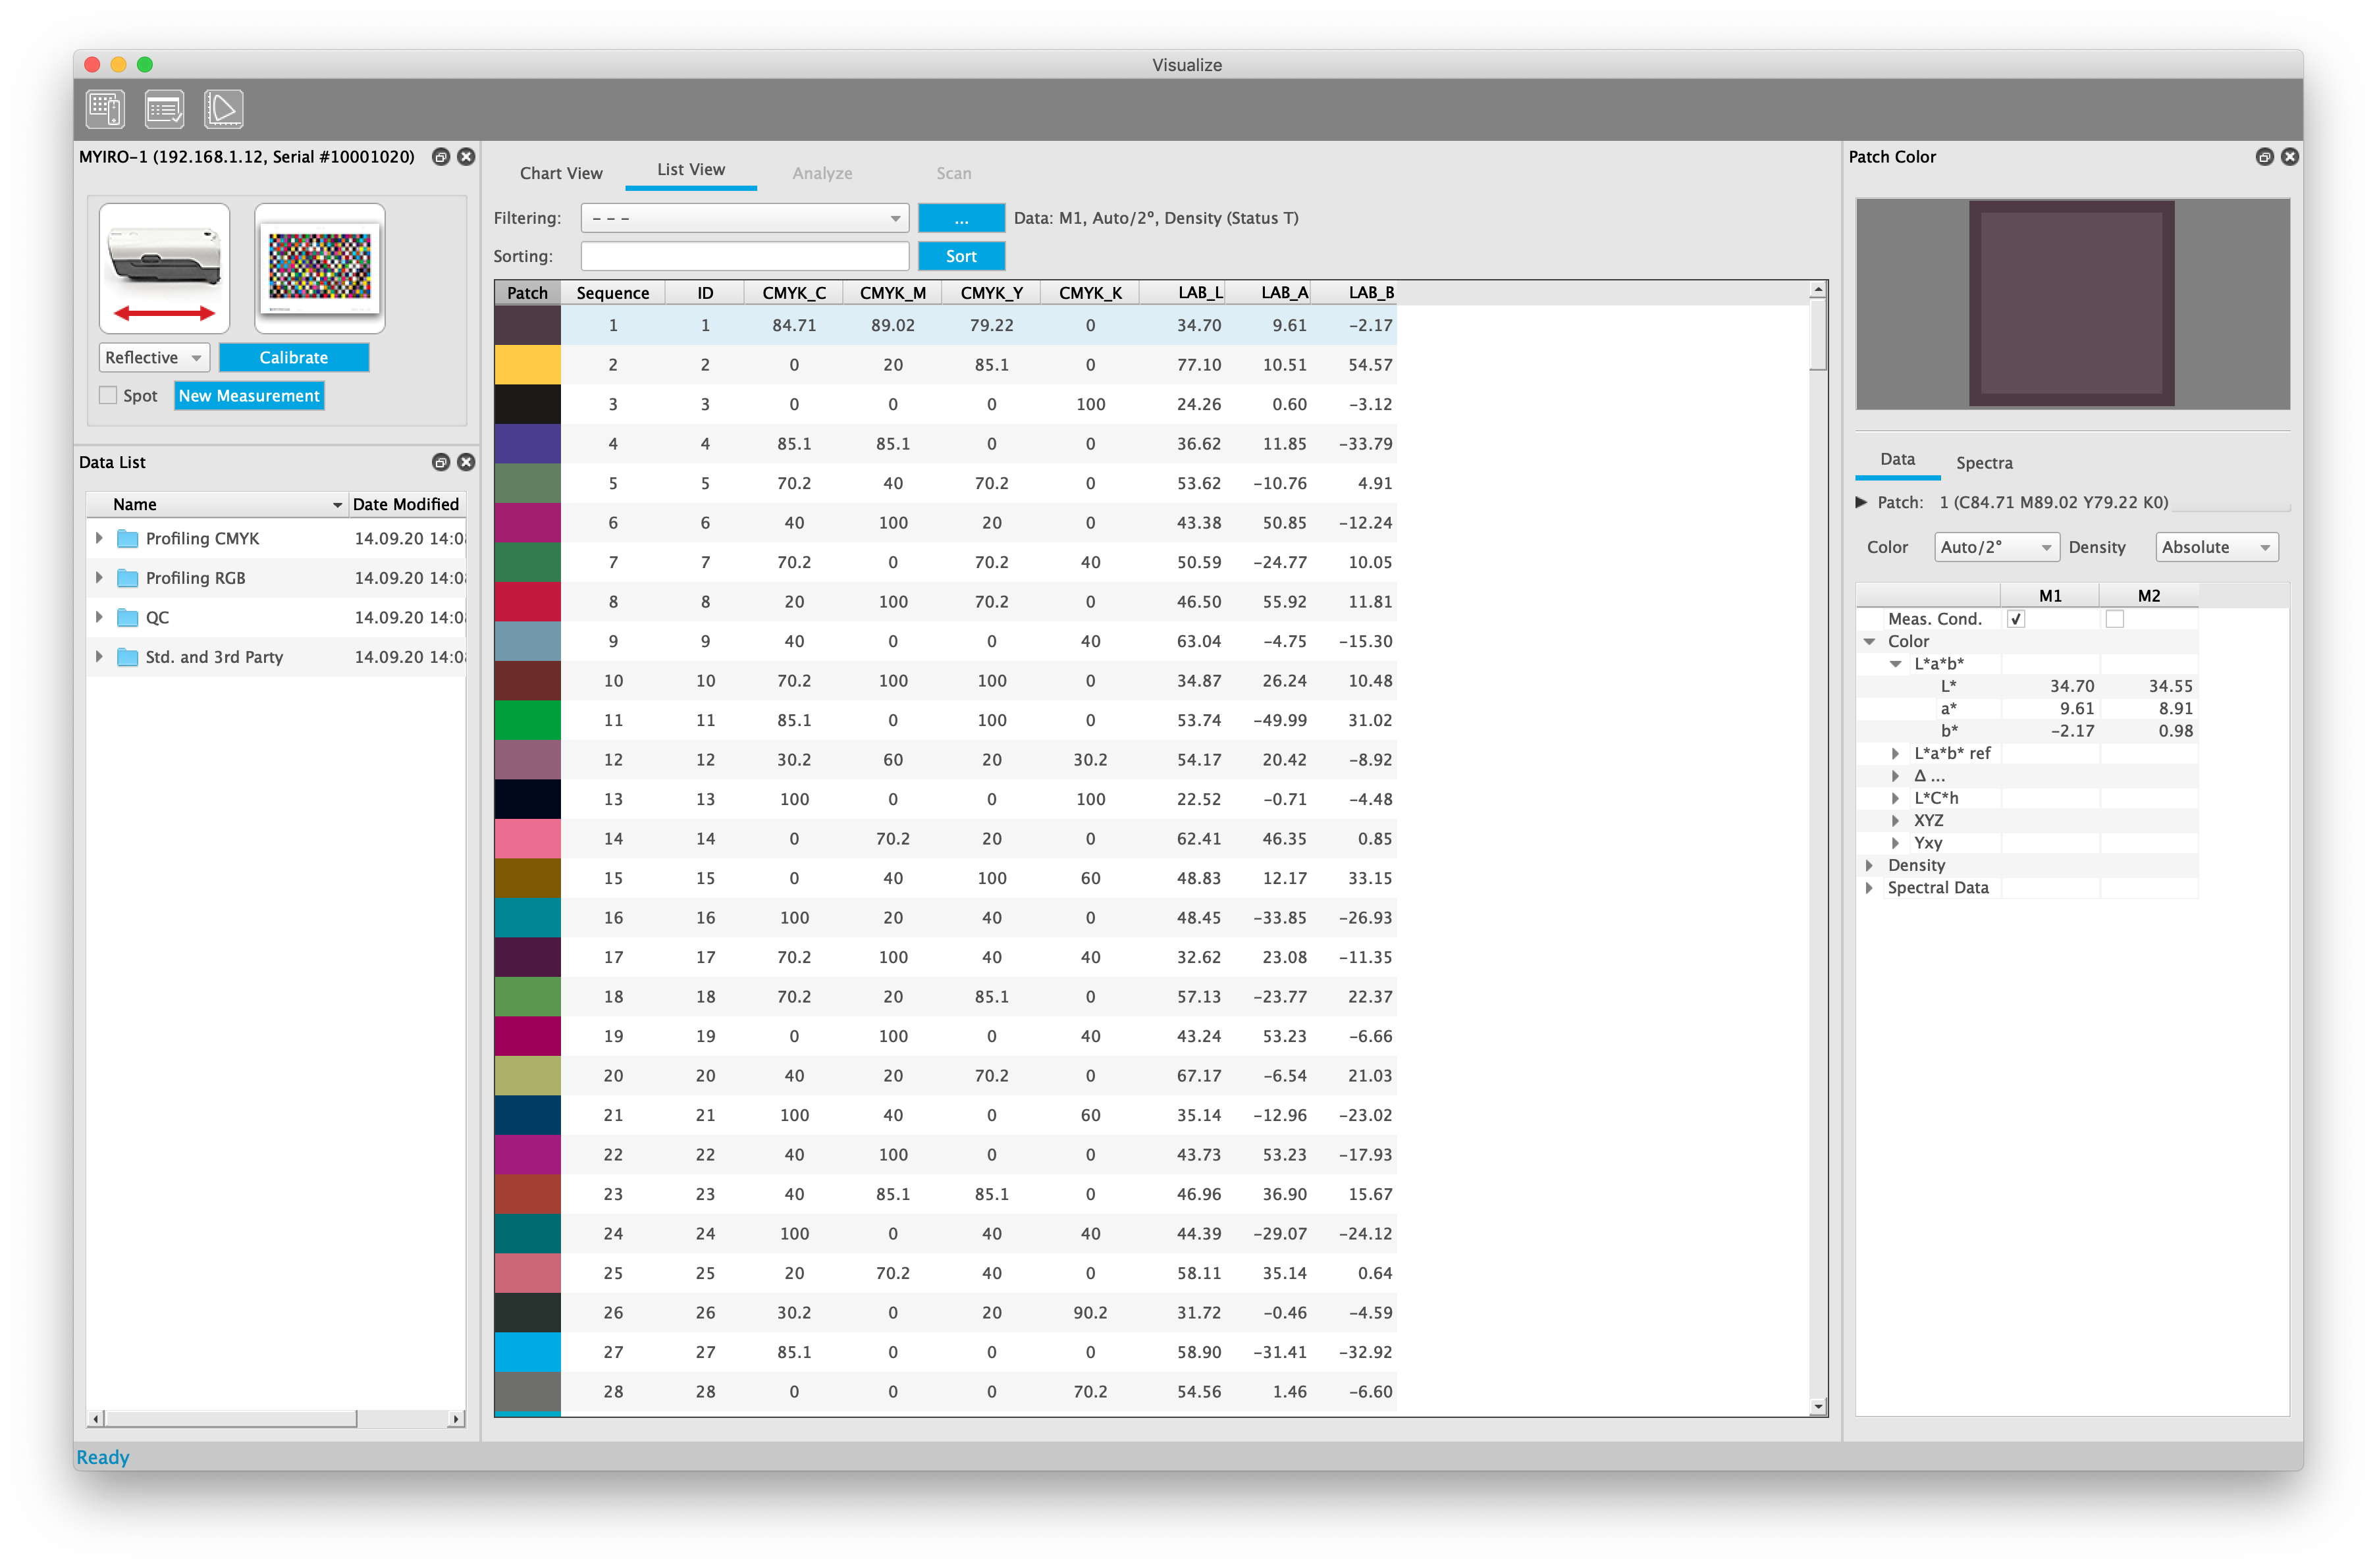
The contents of the list can be influenced.
Right-click onto the column-header and select/deselect the parameters you like to show in the list.
A click on a column sorts the list based on the values of that column.
The first click sorts in ascending a second click in descending order.
The order of the columns can be changed by dragging a column to a different place.
To change the order of a complete logical group (e.g. CMYK_C, CMYK_M, CMYK_Y & CMYK_K) drag the first column of that group.
The other members of that logical group will follow automatically.
On top of the list you can find presets to filter the list.
This allows to quickly find important patches like the solid primaries.
You can create own filter sets by clicking on the button "..." next to the filter preset list.
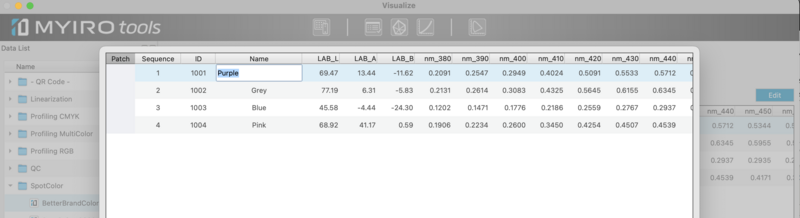
MYIROtools offers templates to create Spotcolor references.
You can find them in the Data List window in the folder "SpotColor".
Choose a template corresponding to the number of samples you need to measure.
By clicking on "Edit" in the top right corner you can enter names for every swatch.
Double-click into the field "Name" in the swatches row and enter a name.
Make a right-click onto your measurement file in the data list.
Select "Rename" and enter a meaningful name.
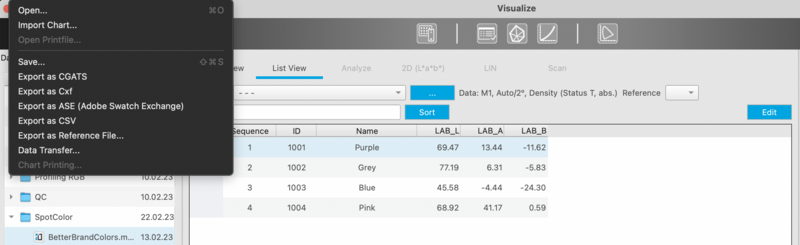
Select your measurement file and select File -> Export as...
Choose ASE to import your definitions into a designsoftware like Adobe Illustrator or Affinity Designer.
Choose CxF to use spectral data in formulation software or to embed the spectral definitions into PDF.
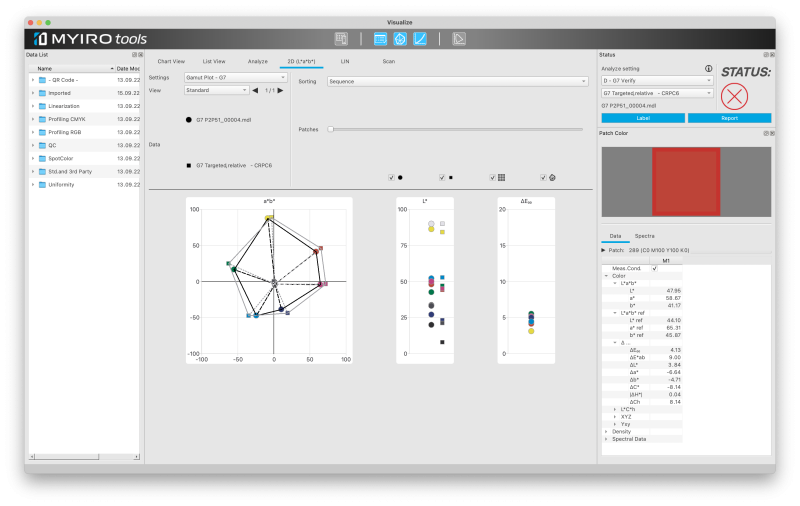
This window shows a 2-dimensional G7 gamut plot (G7 Targeted).
The measurement values for the most important patches to check the conformance for G7 Targeted are plotted into two diagrams:
- CIEa*/CIEb*
- CIEL*
The distribution of color differences is plotted into the ∆E00 graphics.
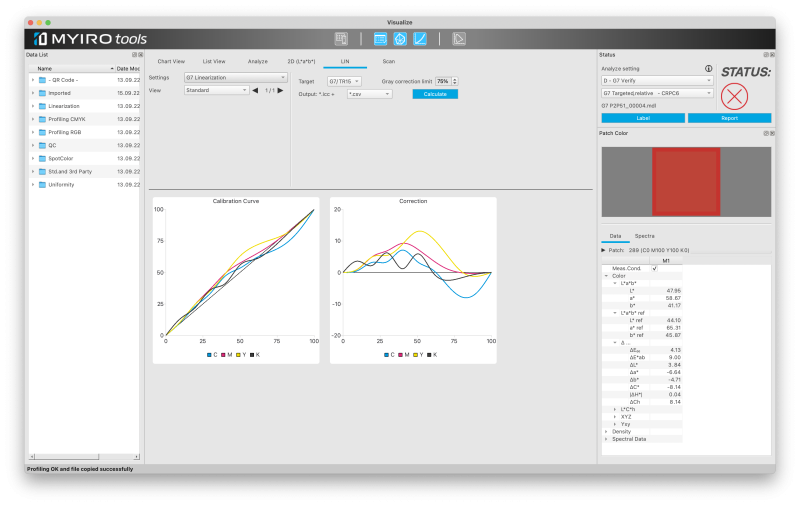
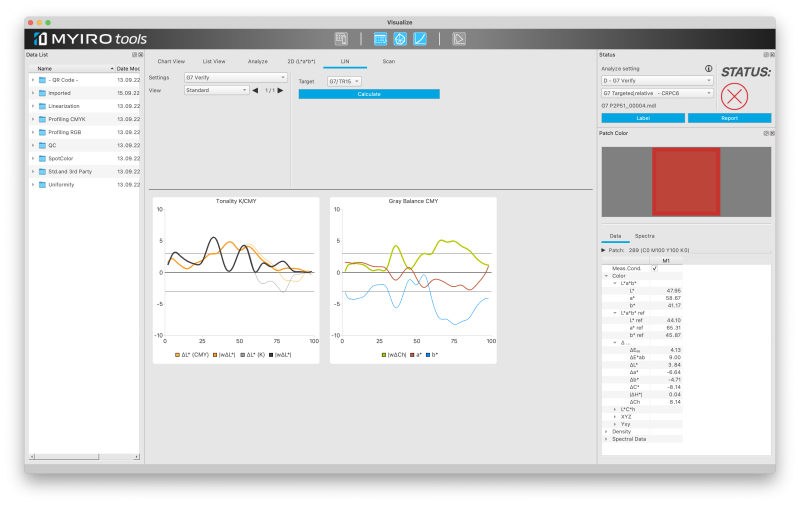
This tab has two functions:
- Display the result of a G7 linearization
- Plot the results of a G7 grayscale evaluation as curves
The available options are:
- G7 Linearization
- G7 Verify
G7 Linearization
After having pressed "Calculate" MYIROtools shows the resulting calibration curves as well as the necessary corrections.
G7 Verify
This option shows the difference of your measurements and the G7 target curve.
You can evaluate the tonality using weighted ∆L* and the neutrality of the gray balance using weighted ∆Ch, CIEa* and CIEb*
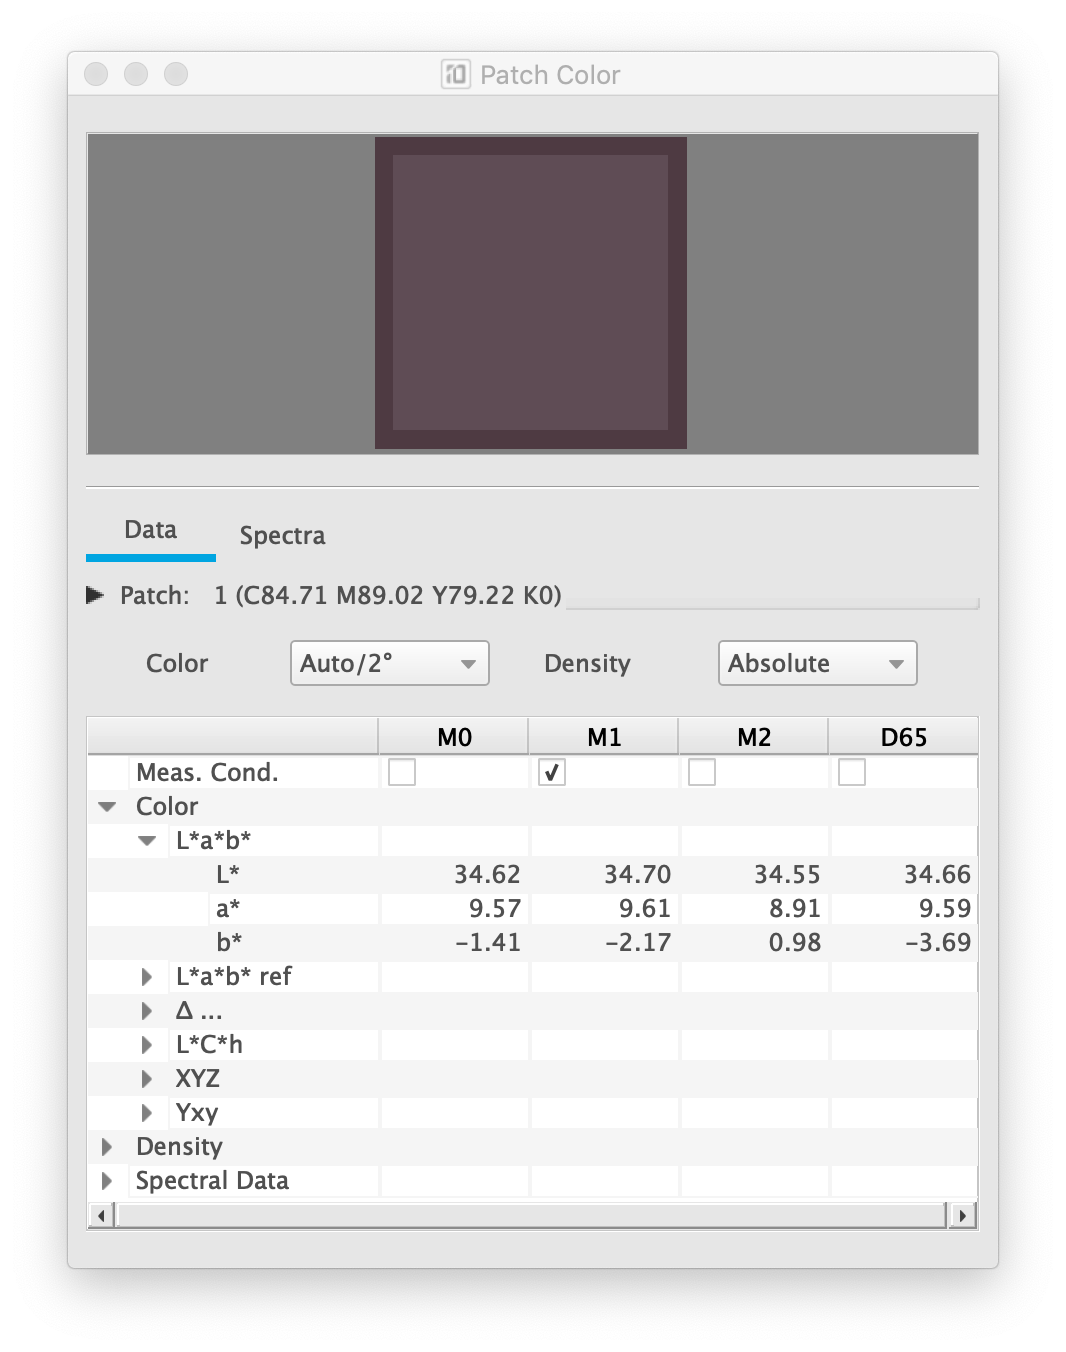
The window "Patch Color" shows details about a patch after it is selected in the main window.
The available details are
- Preview of the color
- Patch ID
- Patch Sequence
- Device value (RGB, CMYK, Grey etc.)
- Patch Name
- Patch Comment
- Color values (CIELAB, CIEXYZ etc.)
- Density values (Status A, Status E, Status I, Status T)
- Spectral data
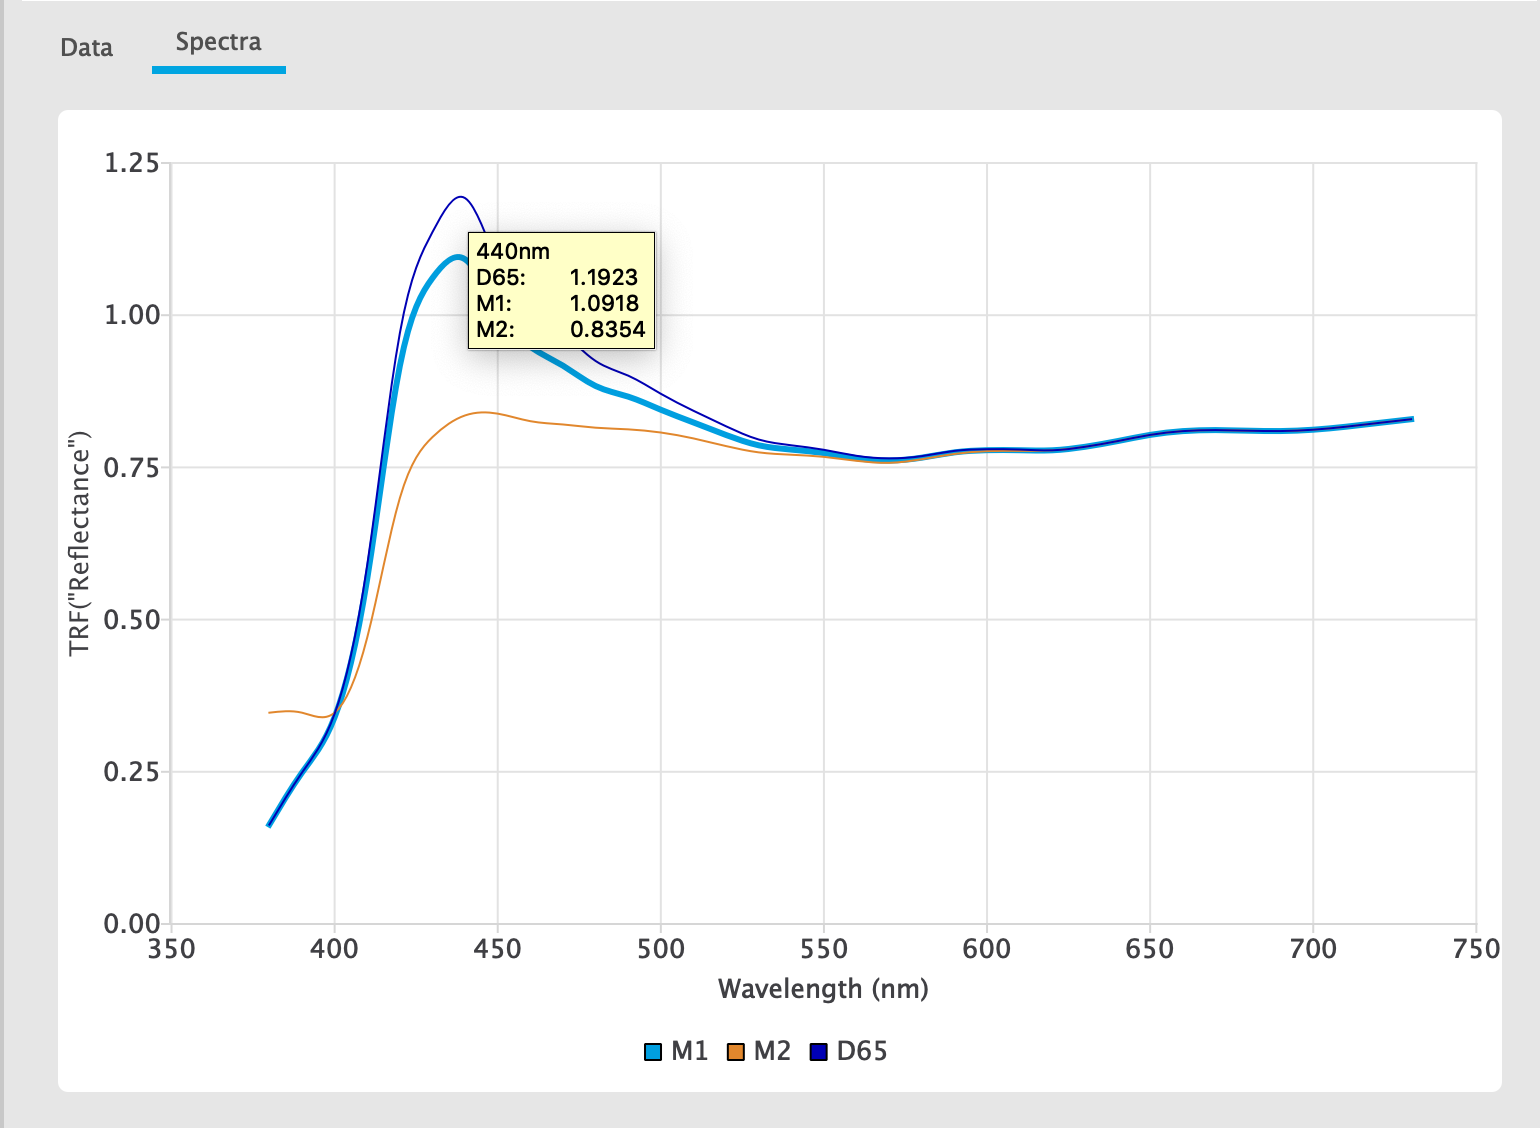
The tab "Spectra" inside the Patch Color Window shows a plot of the spectral data of the selected patch.
The x-axis shows the wavelength in nanometer while the y-axis shows the Total Radiance Factor (TRF) which is the combination of reflectance factor and fluorescence factor.
Multiple measurement conditions can be plotted simultaneously by activating them in the "Data" tab.
Every measurement condition has a fixed color.
By placing the cursor on top of a line the actual values at that wavelength are shown in a separate window.