Analyze Tool
The tool "Analyze" compares measured values against a reference and judges the differences using tolerances from an Analyze setting.
It creates an on-screen report to show if a print is in or out of tolerance.
Analyze Setting
An analyze setting consists of two parts:
- Standard which determines the criteria and tolerances to be used
- Reference Printing Condition to compare against
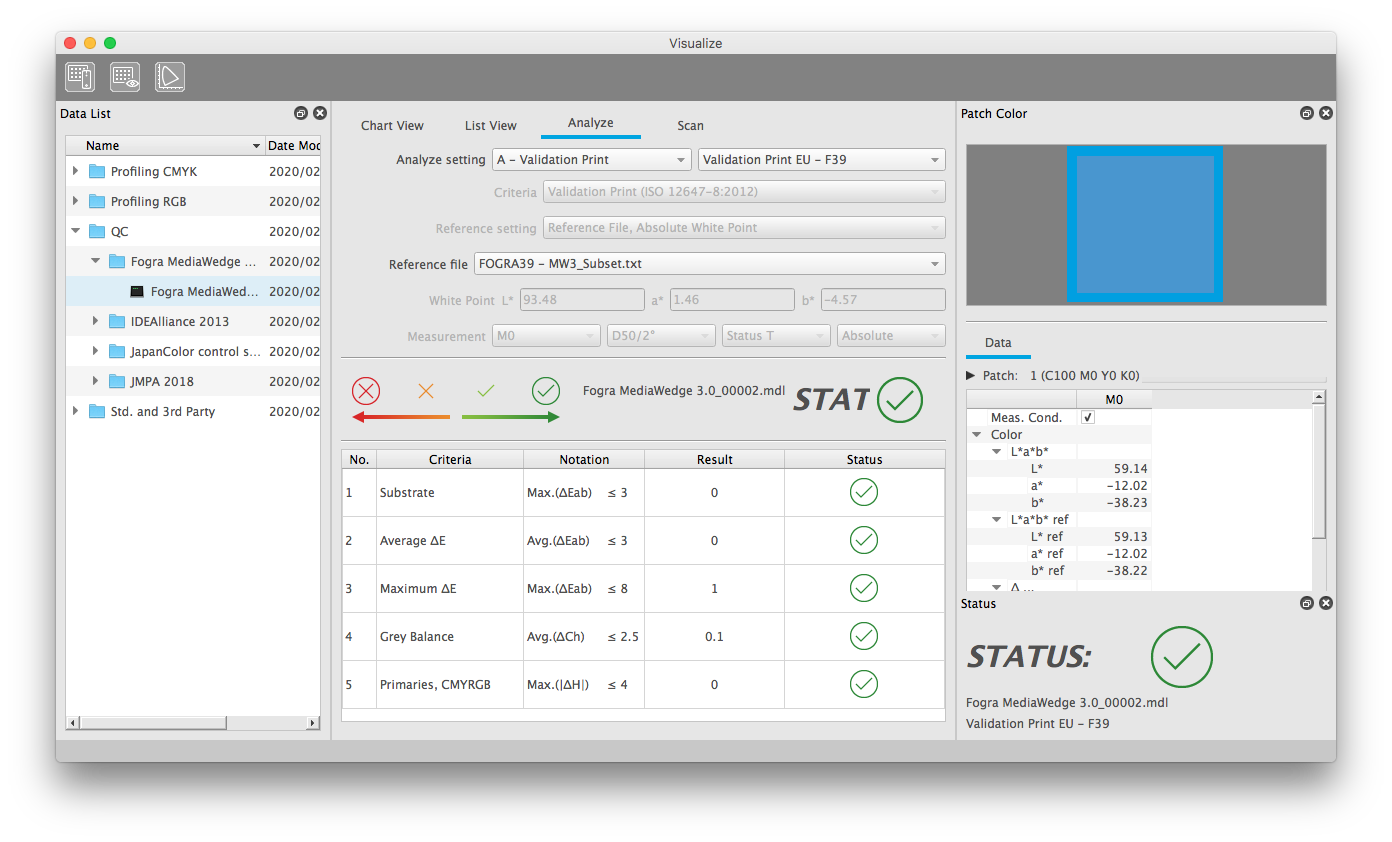
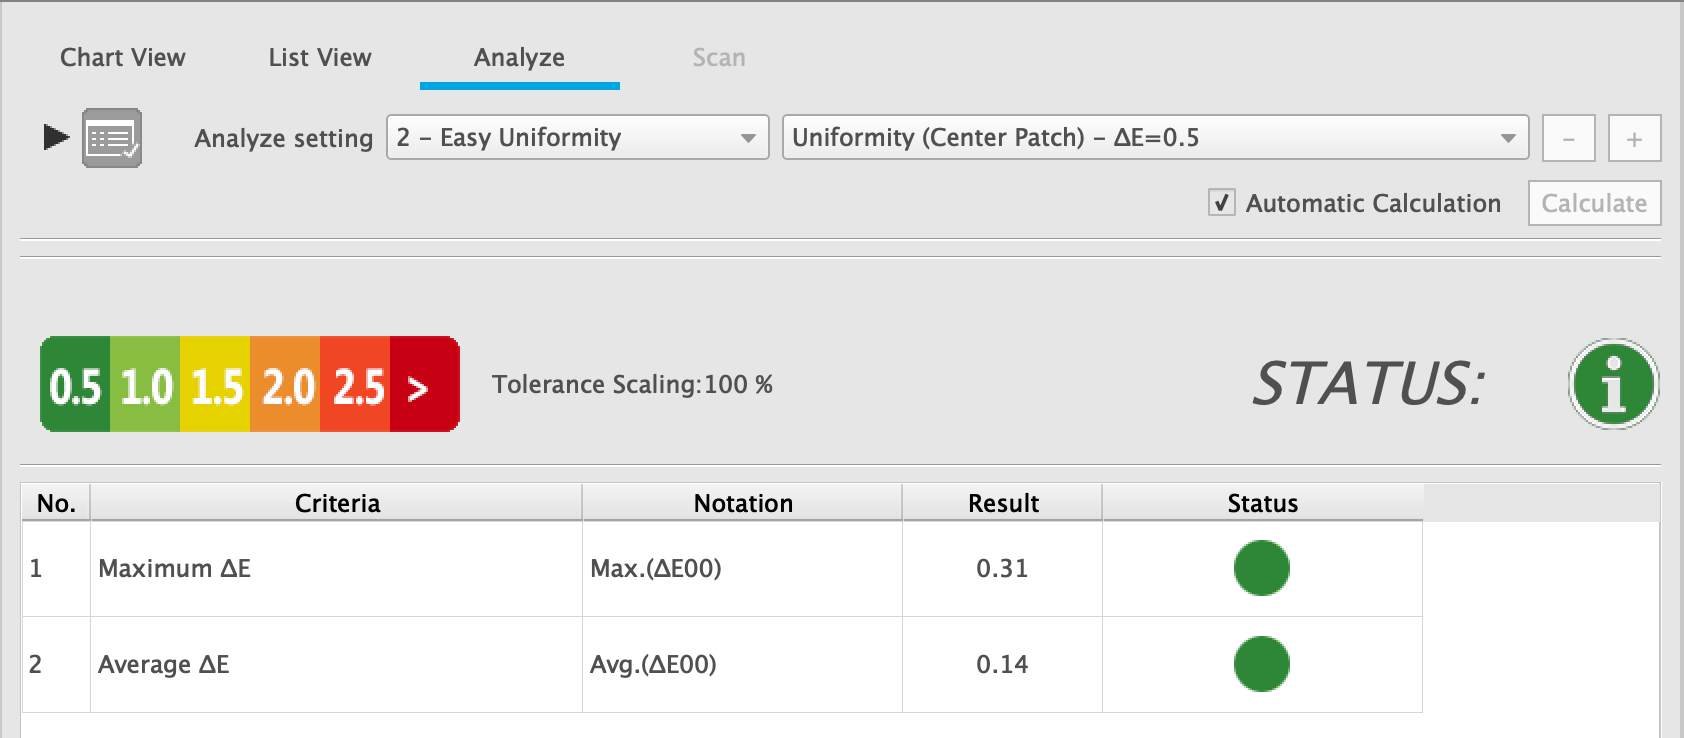
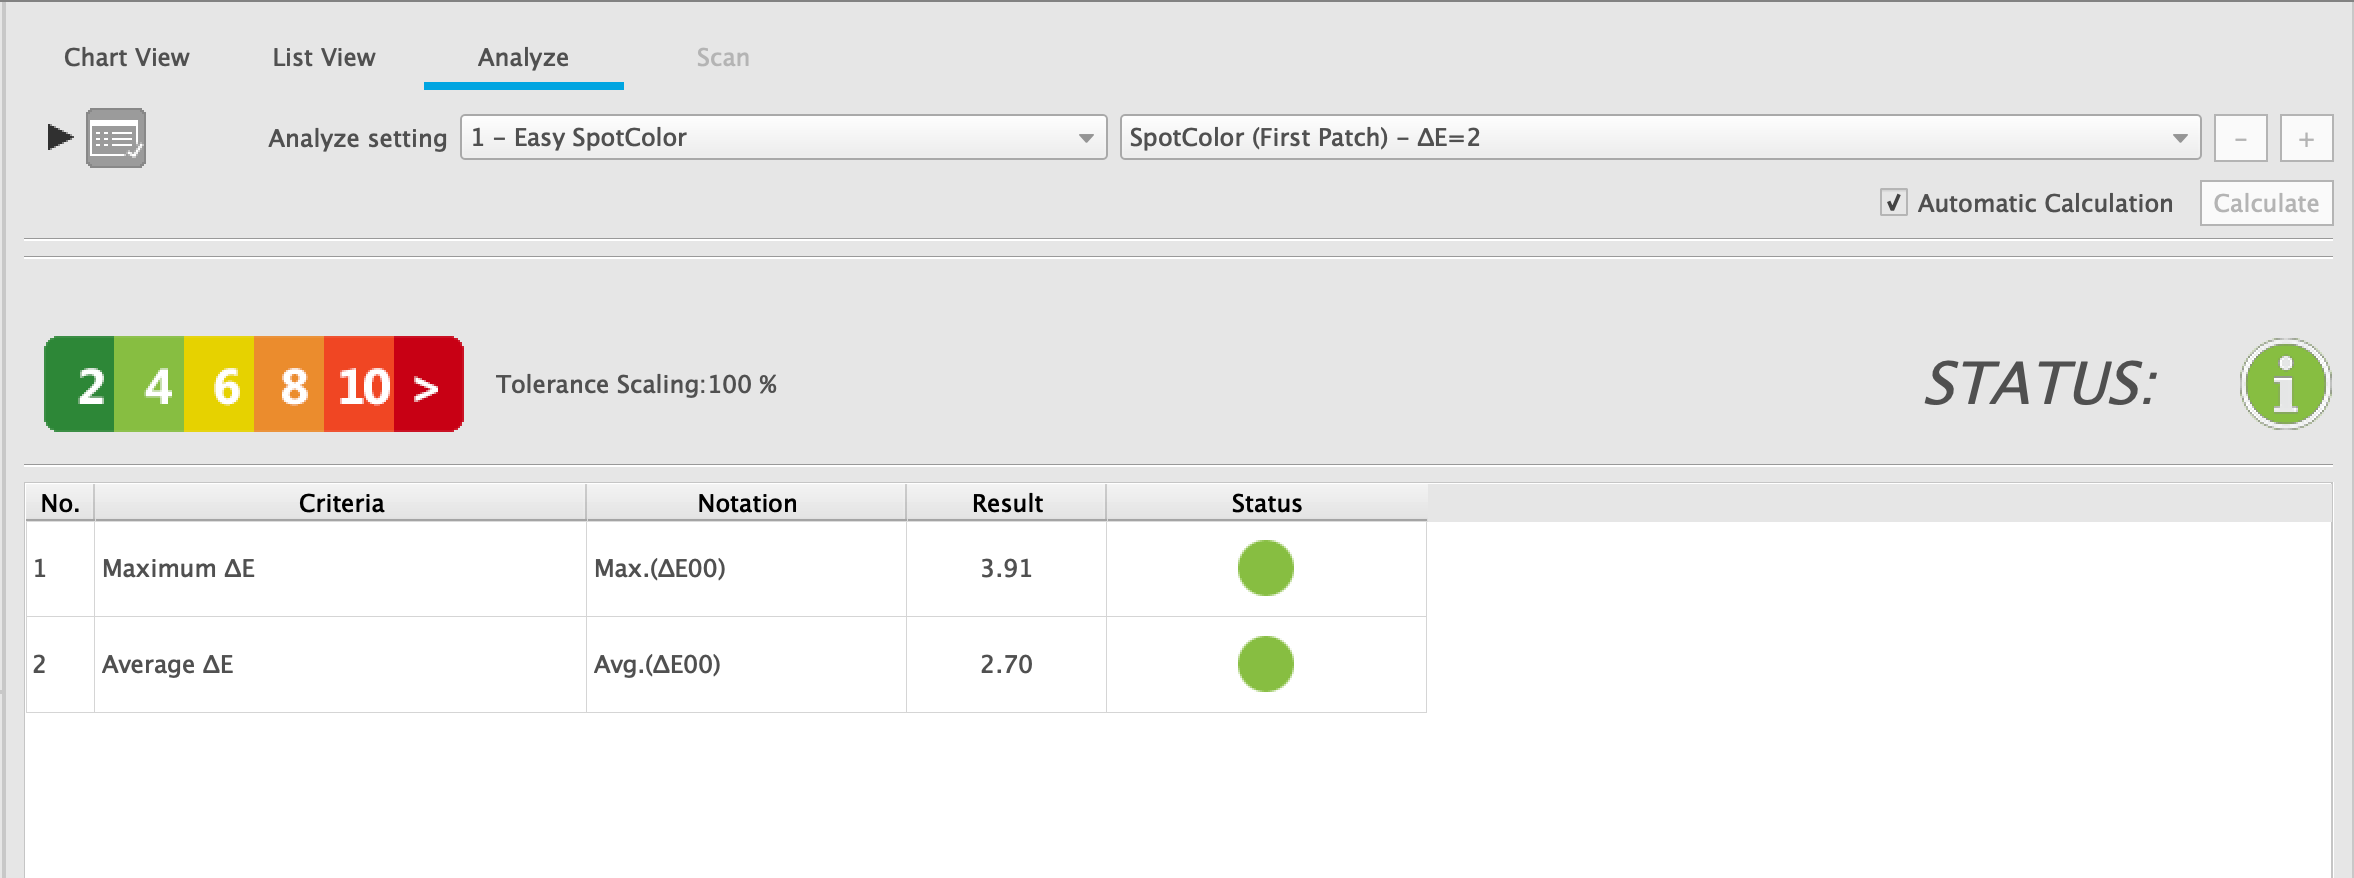
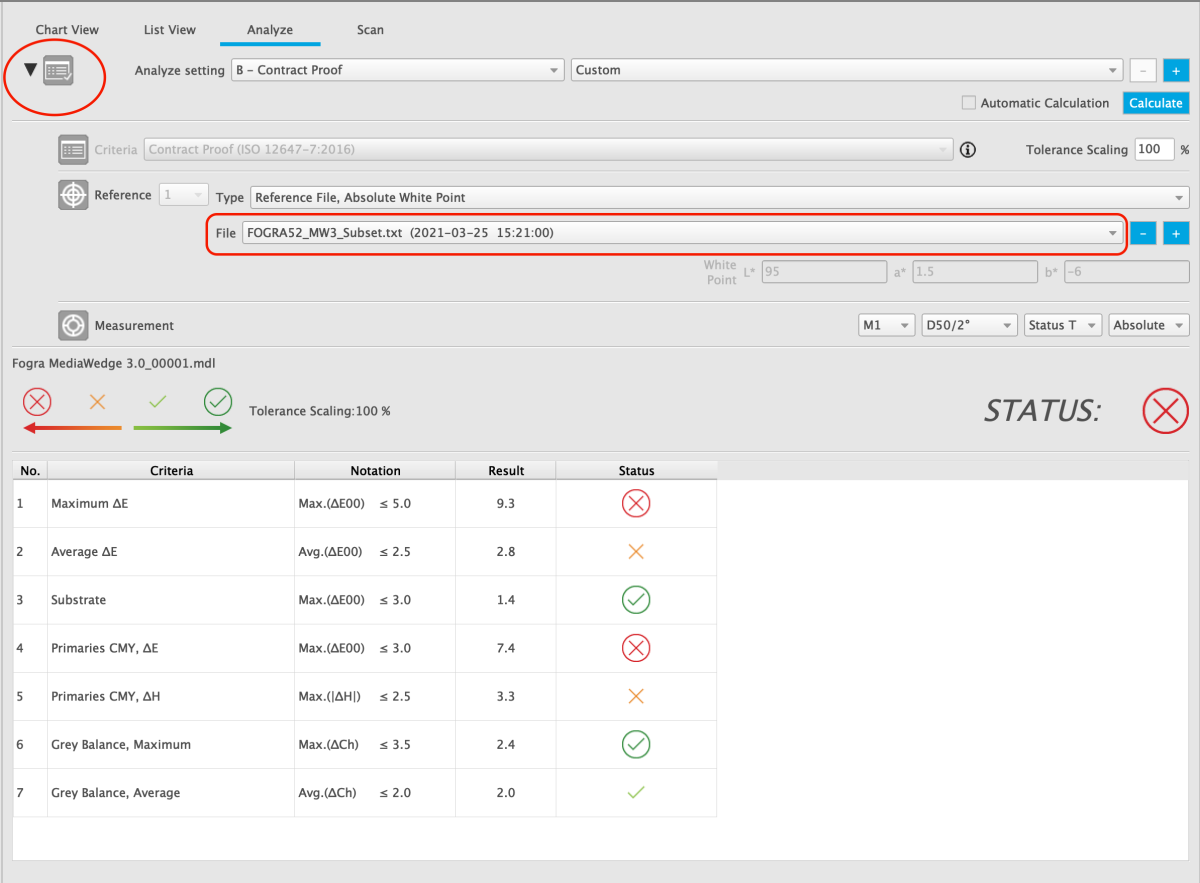
Status report
The status report shows:
- The overall result using four symbols
- Details of criteria and results as a table
- Result for every criteria using four symbols
Value is in tolerance
Value is just in tolerance
Value is slightly out of tolerance
Value is out of tolerance
- Measurements from MYIROtools
- External ISO 28178 ("CGATS") files
- ICC Profiles
The result of Easy Compare is a statistical analysis of the differences.
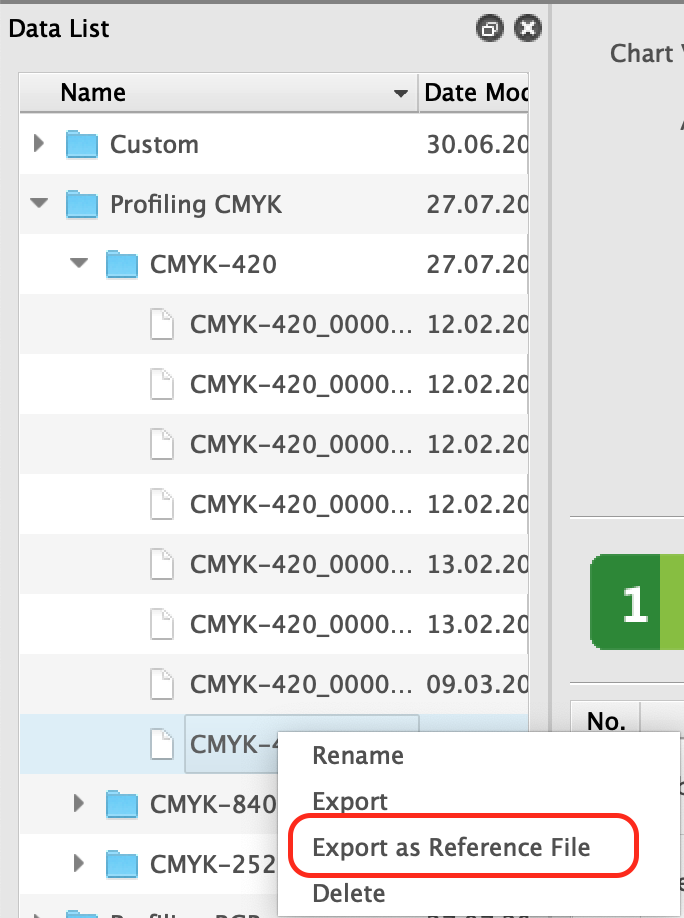
USE EASY COMPARE
- Select a measurement from the Data List
- Select "0 - Easy Compare" as Analyze Setting in the Analyze Tab of the View Module
- Select a Preset
- Choose a reference file from the list
- Choose between "Absolute White Point" or "Relative White Point"
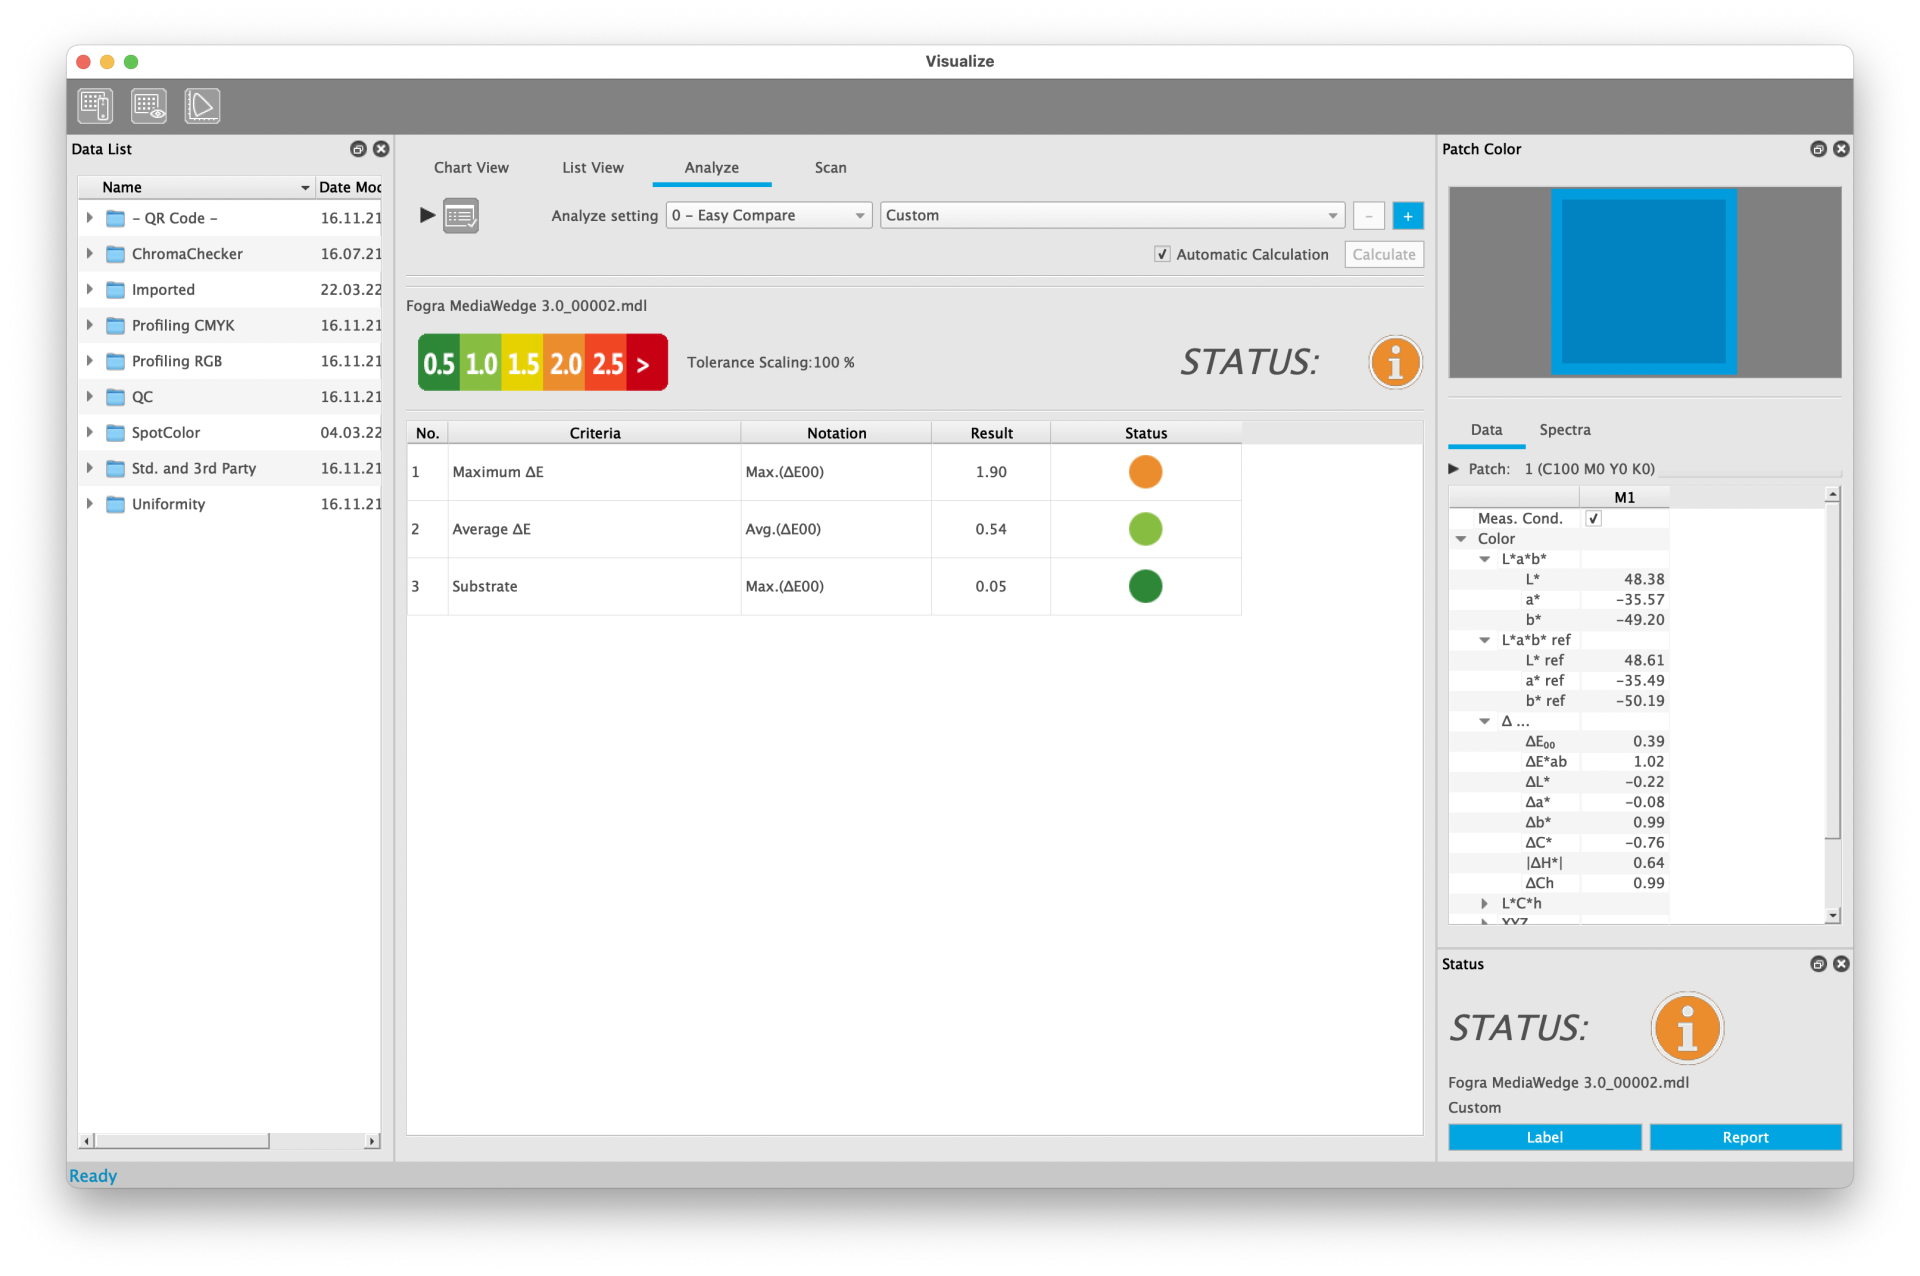
PRESETS AND RESULTS
The presets judge the differences using six steps.
They are encoded in different colors from dark green (small difference) to dark red (big difference).
For every single patch the evaluation result is shown using this color scheme in the "Chart View" and the "List View" tab.
The available step sizes are
∆E = 0.5
∆E = 1.0
∆E = 2.0
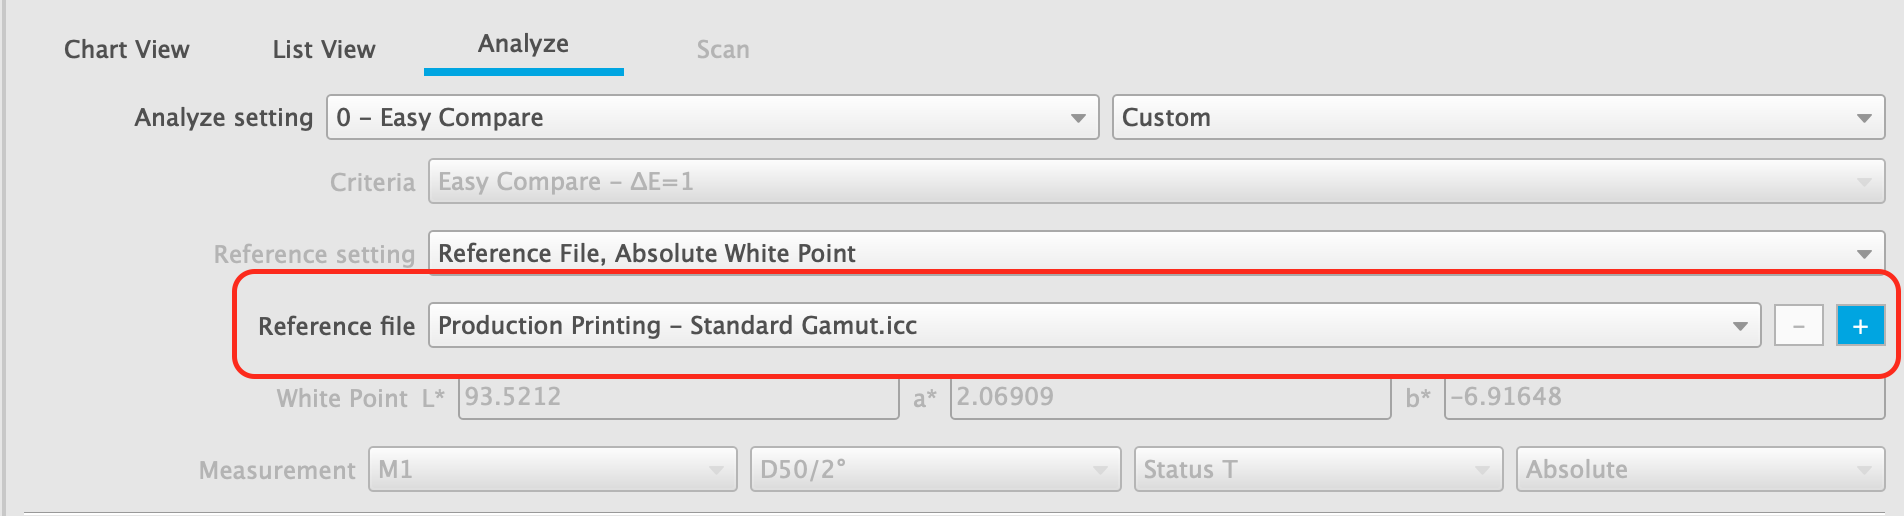
To add an external resource such as an ICC Profile click the "+" button next to the list of reference files and select your file.
It will be copied to a special folder inside the MYIROtools working folder and appears at the bottom of the list.
User Reference files can be removed from the list. They will be deleted from the MYIROtools working folder.
Select your file and click the "-" button next to the list.

MYIROtools Basic offers the most important quality control settings.
- A: Validation Print
- Criteria and tolerances taken from ISO 12647-8
- B: Contract Proof
- Criteria and tolerances taken from ISO 12647-7
- C: Solid Densities
- This setting informs about the densities of the solid primaries
- D: G7 Verify
- Criteria and tolerances for G7 validation
- E: PSD PrintCheck
- Criteria and tolerances for PSD validation
- F: QC Photo
- Criteria and tolerances for Photobook production
These settings are combined with the most important reference printing conditions
- FOGRA39
- FOGRA51
- Japan Color 2011
- JMPA2018
- ISO/PAS 15339 CRPC6
- MYIROtools Advanced offers the possibility to customize the Analyze settings.
With a license for MYIROtools Advanced it is possible to customize the settings of the Quality Control module Analyze.
The following parameters can be adjusted:
- Reference type
- Reference file
- Measurement condition
- Tolerances
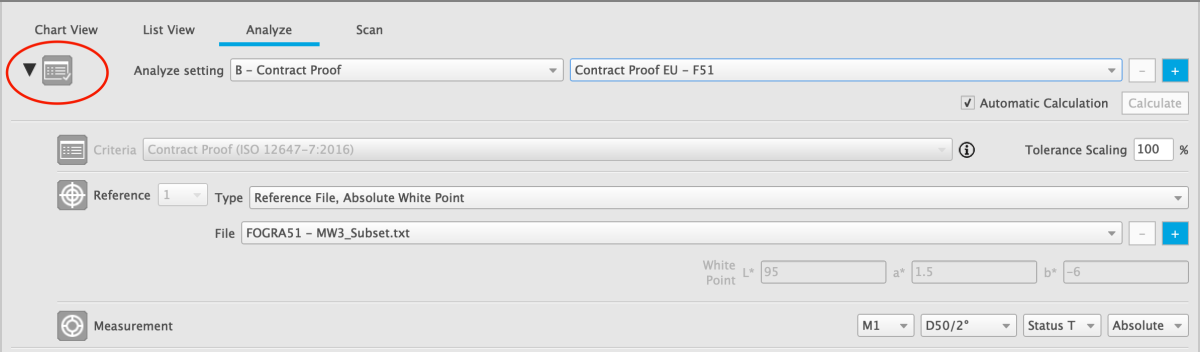
In order to change a parameter it is necessary to show them by clicking onto the rectangle in the top left corner.
The available reference types are:
- Reference File, Absolute Whitepoint
- The reference values that are used are taken from a reference file which can be selected below ("File").
The whitepoint that is used for the calculations is taken from the reference file.
This is the reference type that is typically used for quality control.
- The reference values that are used are taken from a reference file which can be selected below ("File").
- Reference File, Relative Whitepoint
- The reference values that are used are taken from a reference file which can be selected below ("File").
The measurement values are scaled based on the whitepoint from this reference file.
As a result the color difference of paper white equals 0.
This is the reference type that is used for SCCA and Fogra PSD mediarelative.
- The reference values that are used are taken from a reference file which can be selected below ("File").
- Reference File, Custom Whitepoint
- The reference values that are used are taken from a reference file which can be selected below ("File").
These reference values and the measurement values are scaled based on a whitepoint that is set by the user.
As a result the color difference of paper white equals 0.
- The reference values that are used are taken from a reference file which can be selected below ("File").
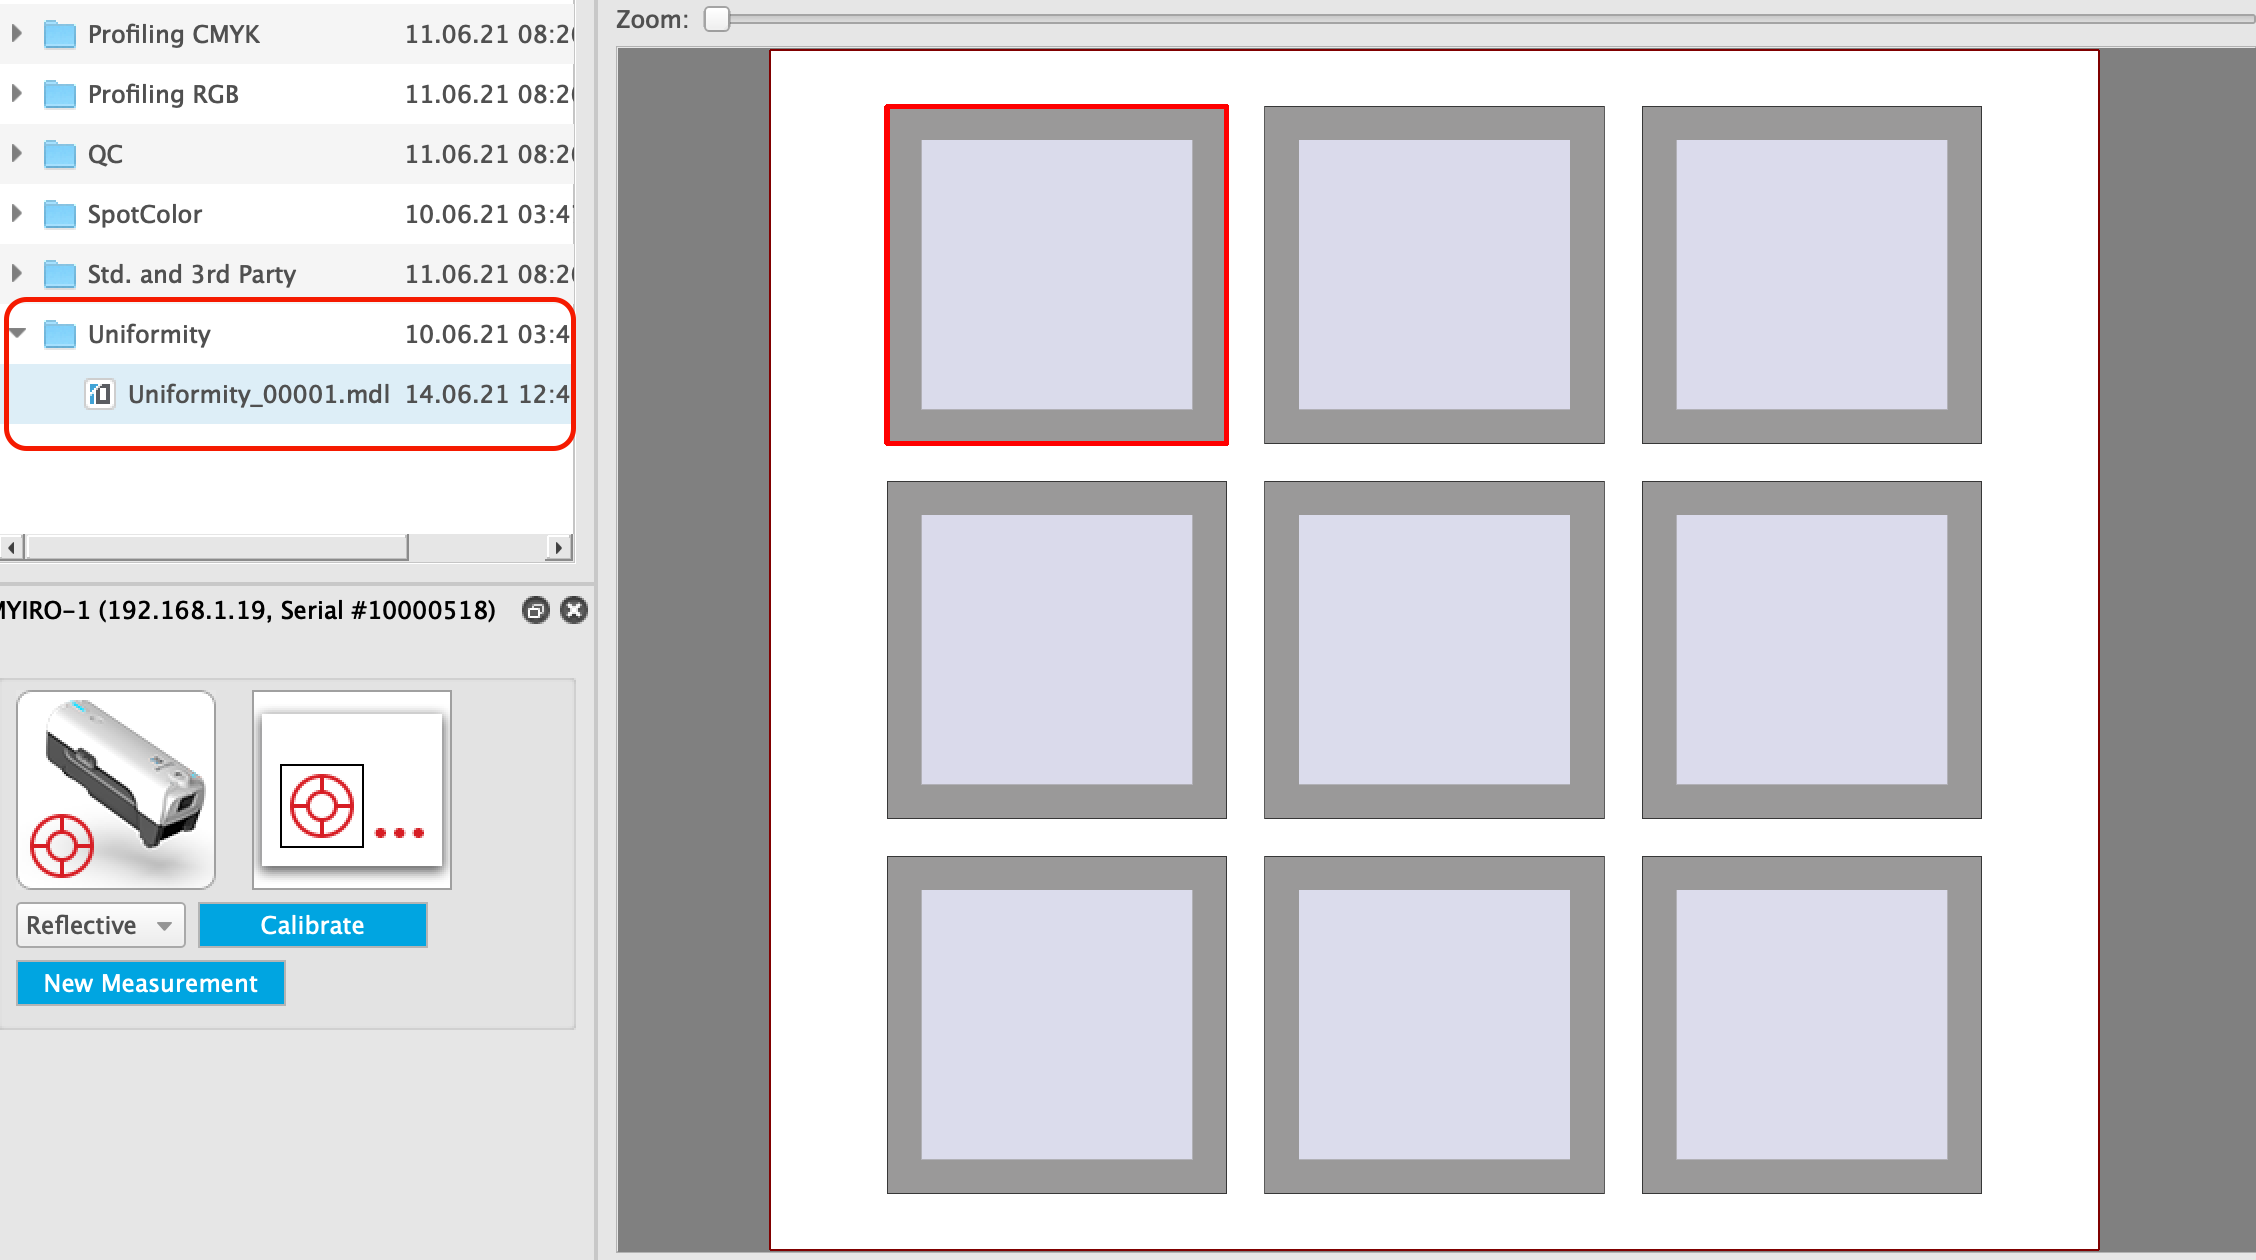
- Single Patch, Measurement ID
- Used for Spot-Color and Uniformity evaluation.
The reference value is a single patch. It is identified by the ID in the chart definition.
- Used for Spot-Color and Uniformity evaluation.
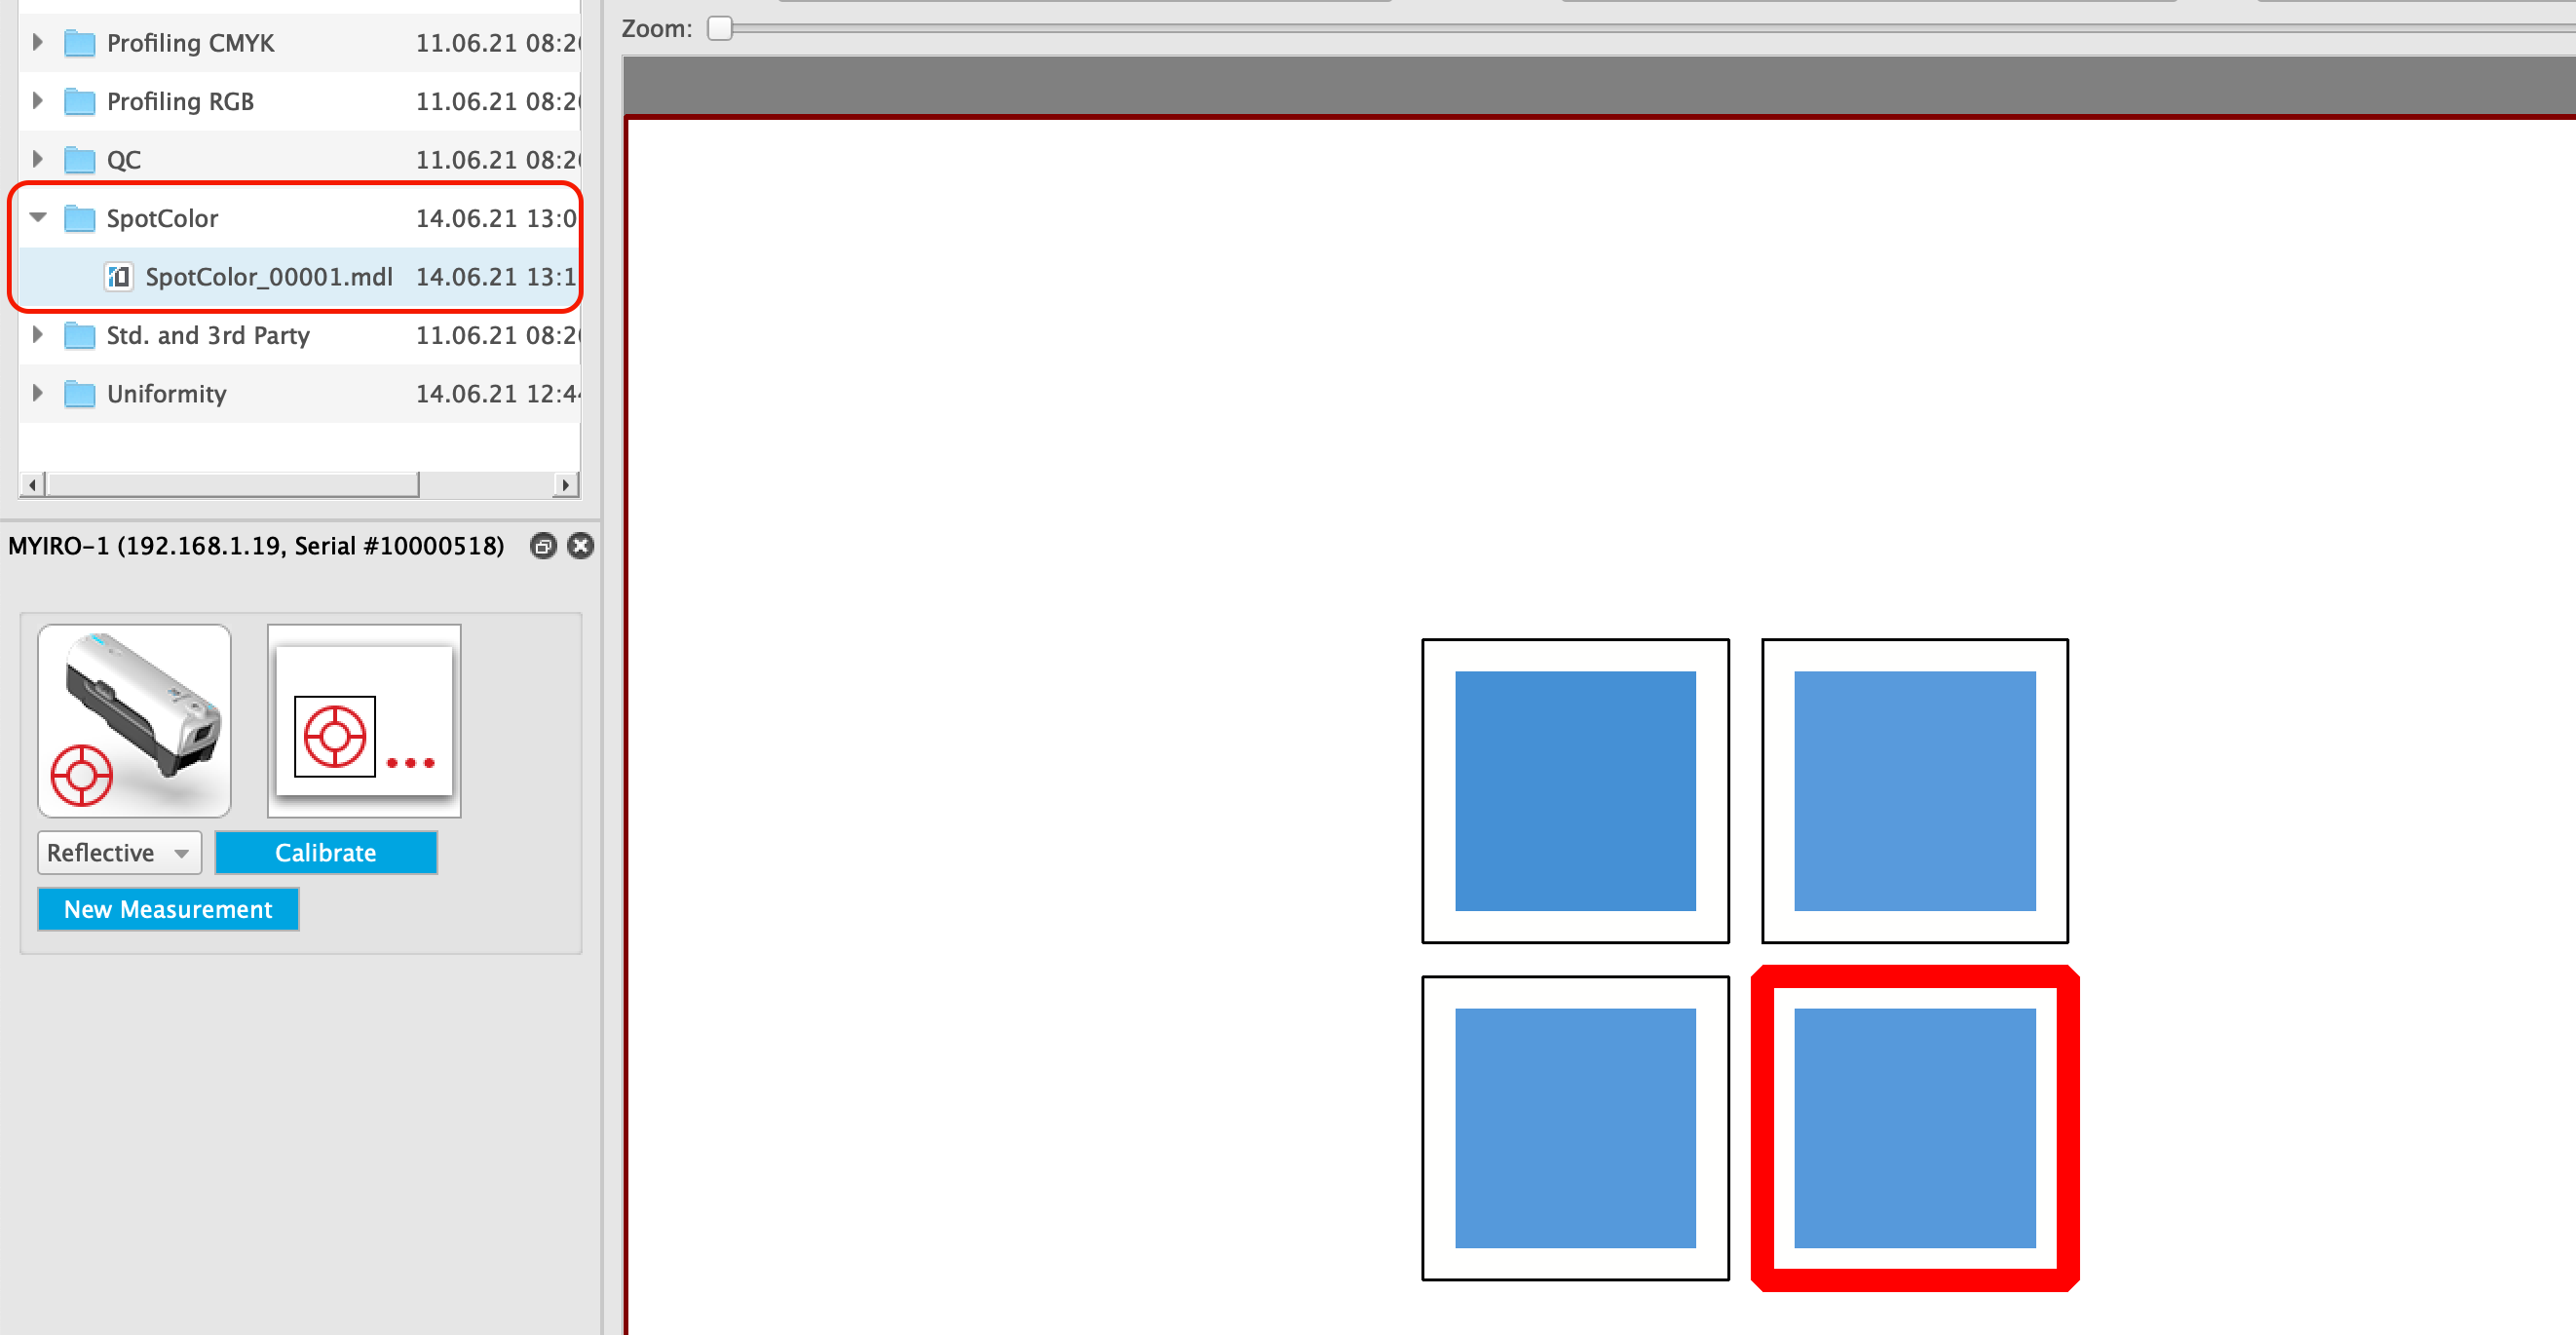
- Single Patch, Measurement Sequence
- Used for Spot-Color and Uniformity evaluation.
The reference value is a single patch. It is identified by its position in the measurement sequence.
Sequence = 1 means that the first measured patch is used as a reference.
- Used for Spot-Color and Uniformity evaluation.
- Single Patch, Measurement Filter
- Used for Spot-Color and Uniformity evaluation.
The reference value is selected based on the filter set selected in List View.
- Used for Spot-Color and Uniformity evaluation.
MYIROtools has several preinstalled standard printing conditions as reference files. These can be selected from a list (see screenshot) and used for quality control.
To add a custom reference file click on the "+" and select a file from your harddisk. It will appear under "User Reference File" in the list.
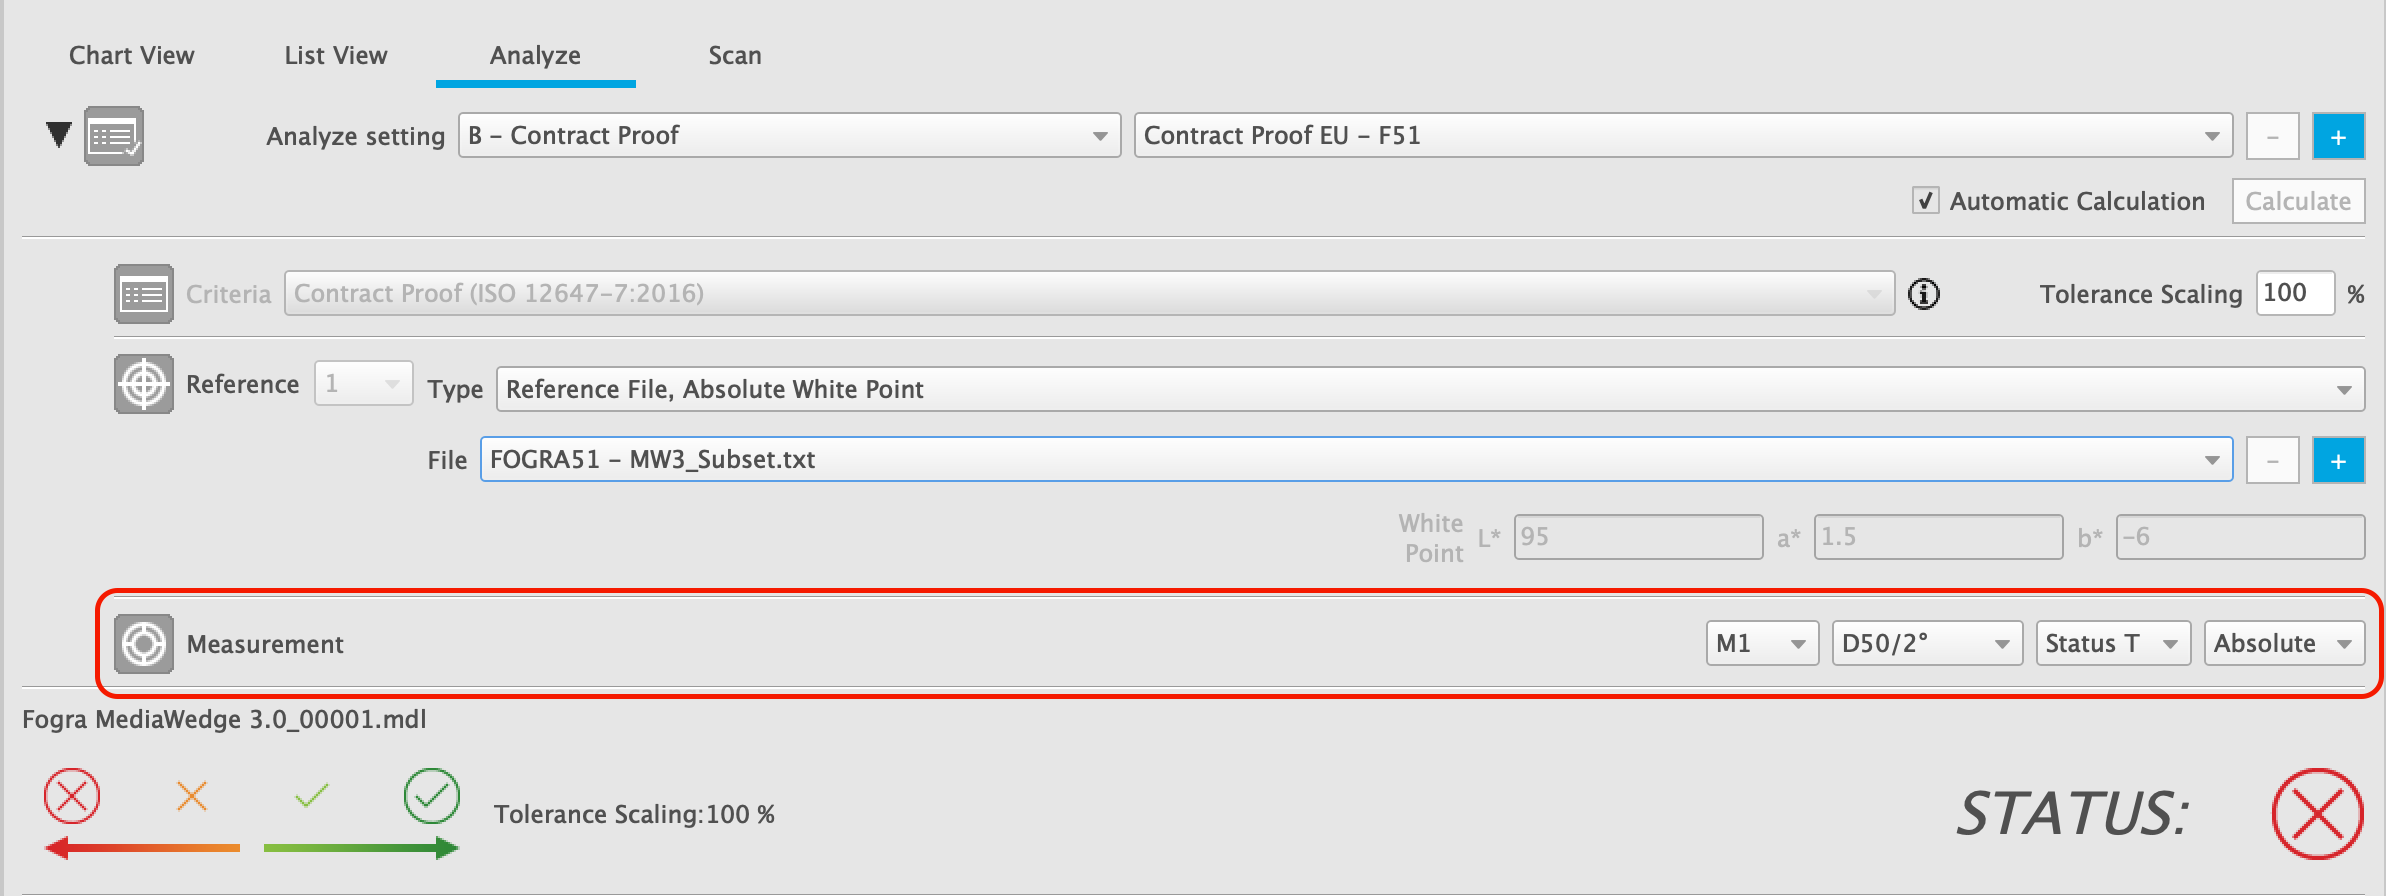
The measurement condition that is used for the analysis can be adjusted. The settings affect only the selected measurement file. The measurement condition of the reference is taken from the reference file. Therefore these settings should only be adjusted for good reasons.
Options for colorimetric values (e.g. CIELAB)
The first list sets the measurement light source.
The second list sets the reference illuminant and observer.
Options for densitometric values
The list of status options defines the filter set that is used to calculate the densities.
The last list defines if the densities are calculated absolute ("Paper" has a density > 0) or relative ("Paper" density = 0).
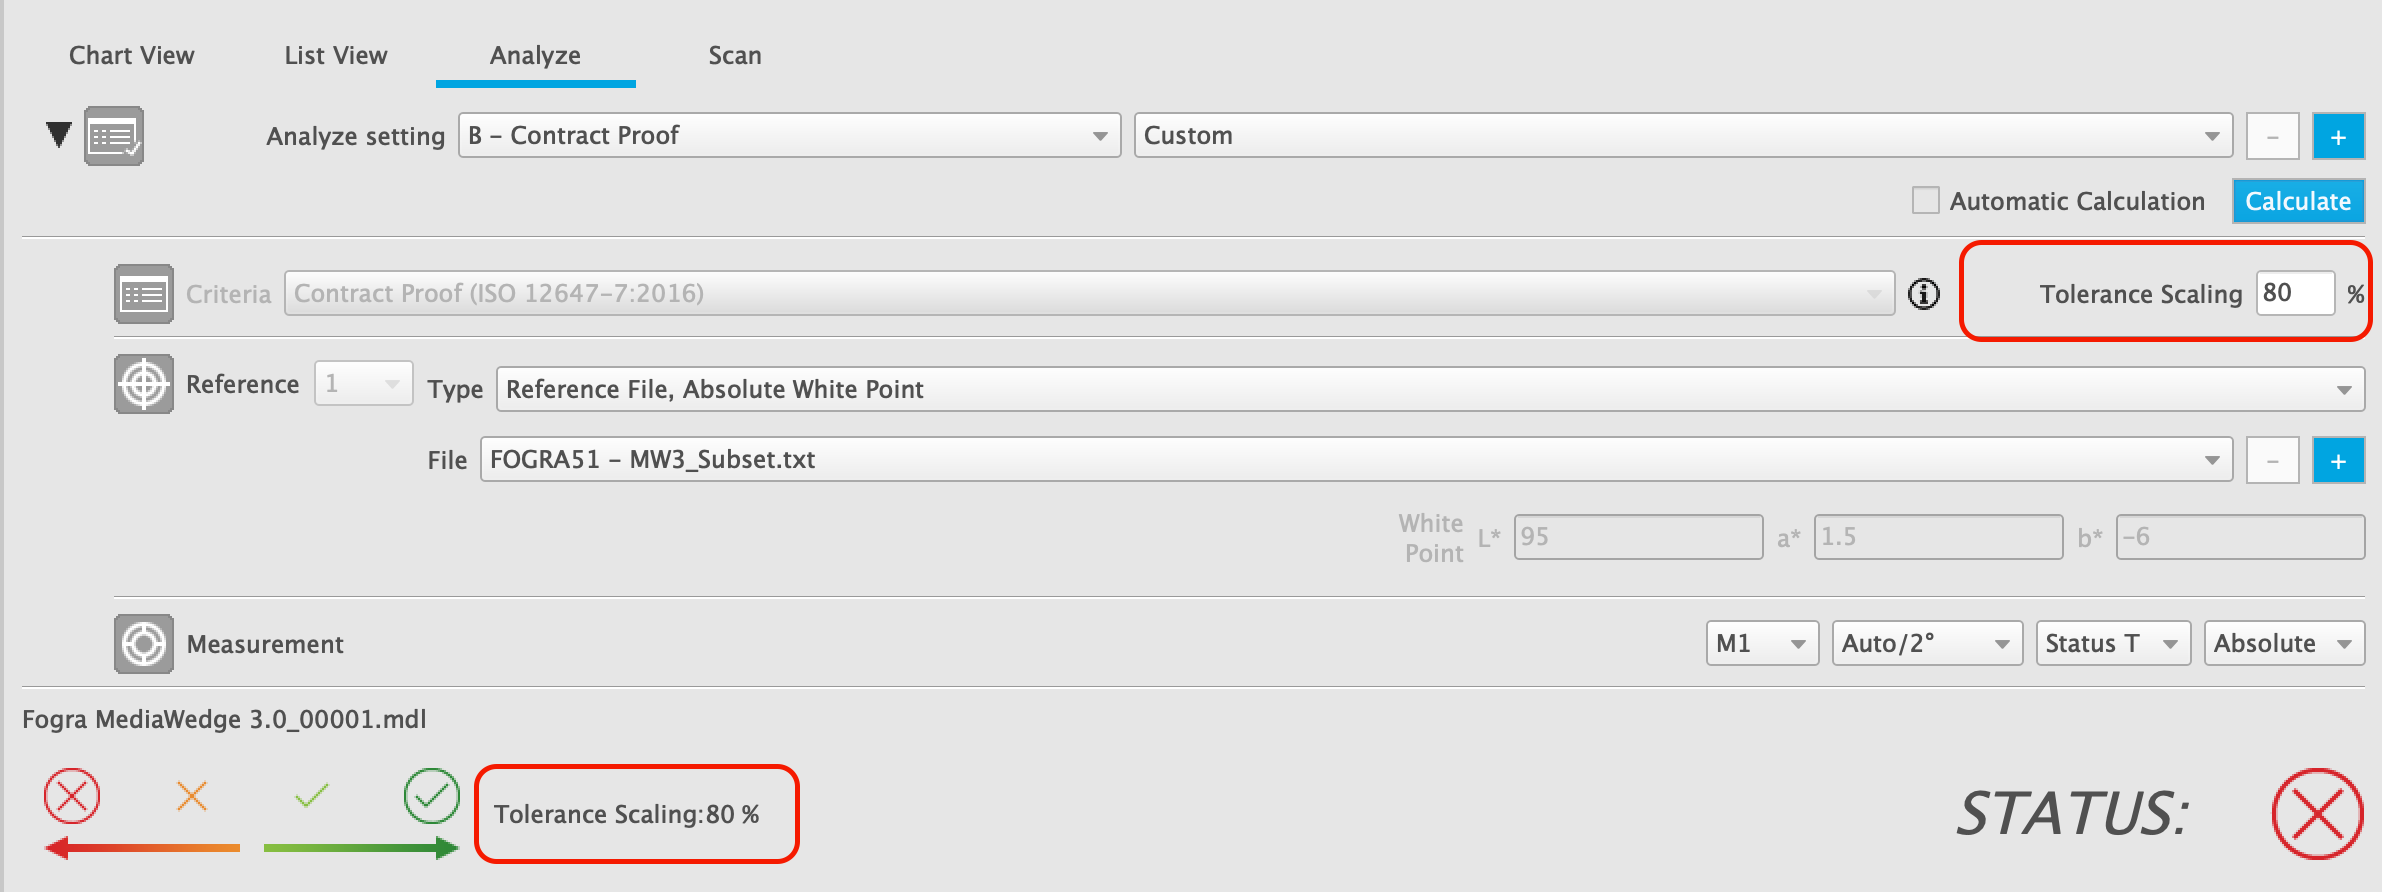
In MYIROtools Advanced it is possible to change the standard tolerances for the evaluation.
This is achieved by setting a scaling factor for the tolerances as a percentage.
A scaling factor of 80% changes a tolerance of dE = 10 to dE = 8.
A tolerance of dE = 5 is changed to dE = 4 etc.
A scaling factor can also be set to a value > 100% to create a less strict judgment.
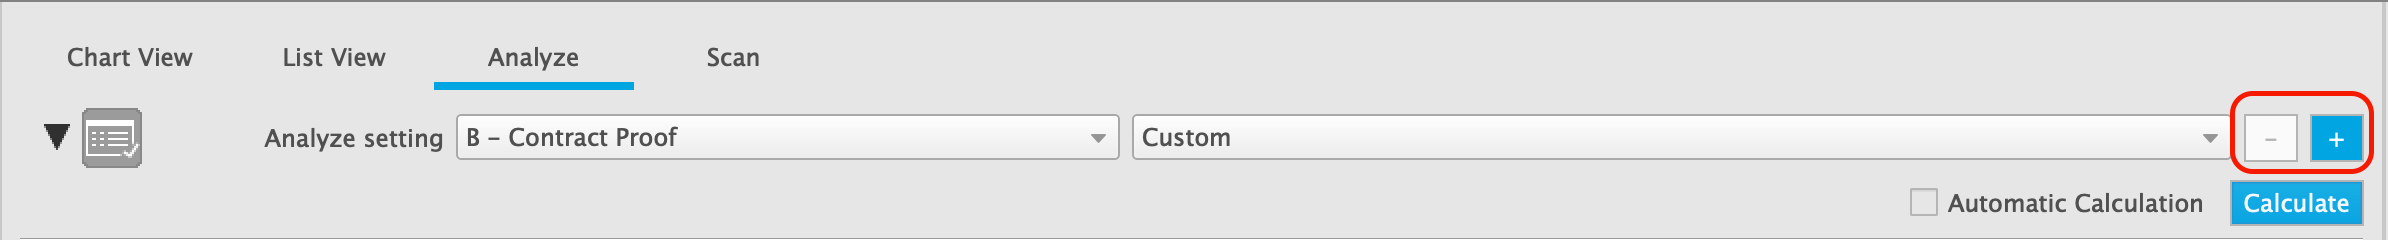
Using the "+" button you can save your customized Analyze Setting. It will appear in the list and can be used for other quality control jobs in the future.
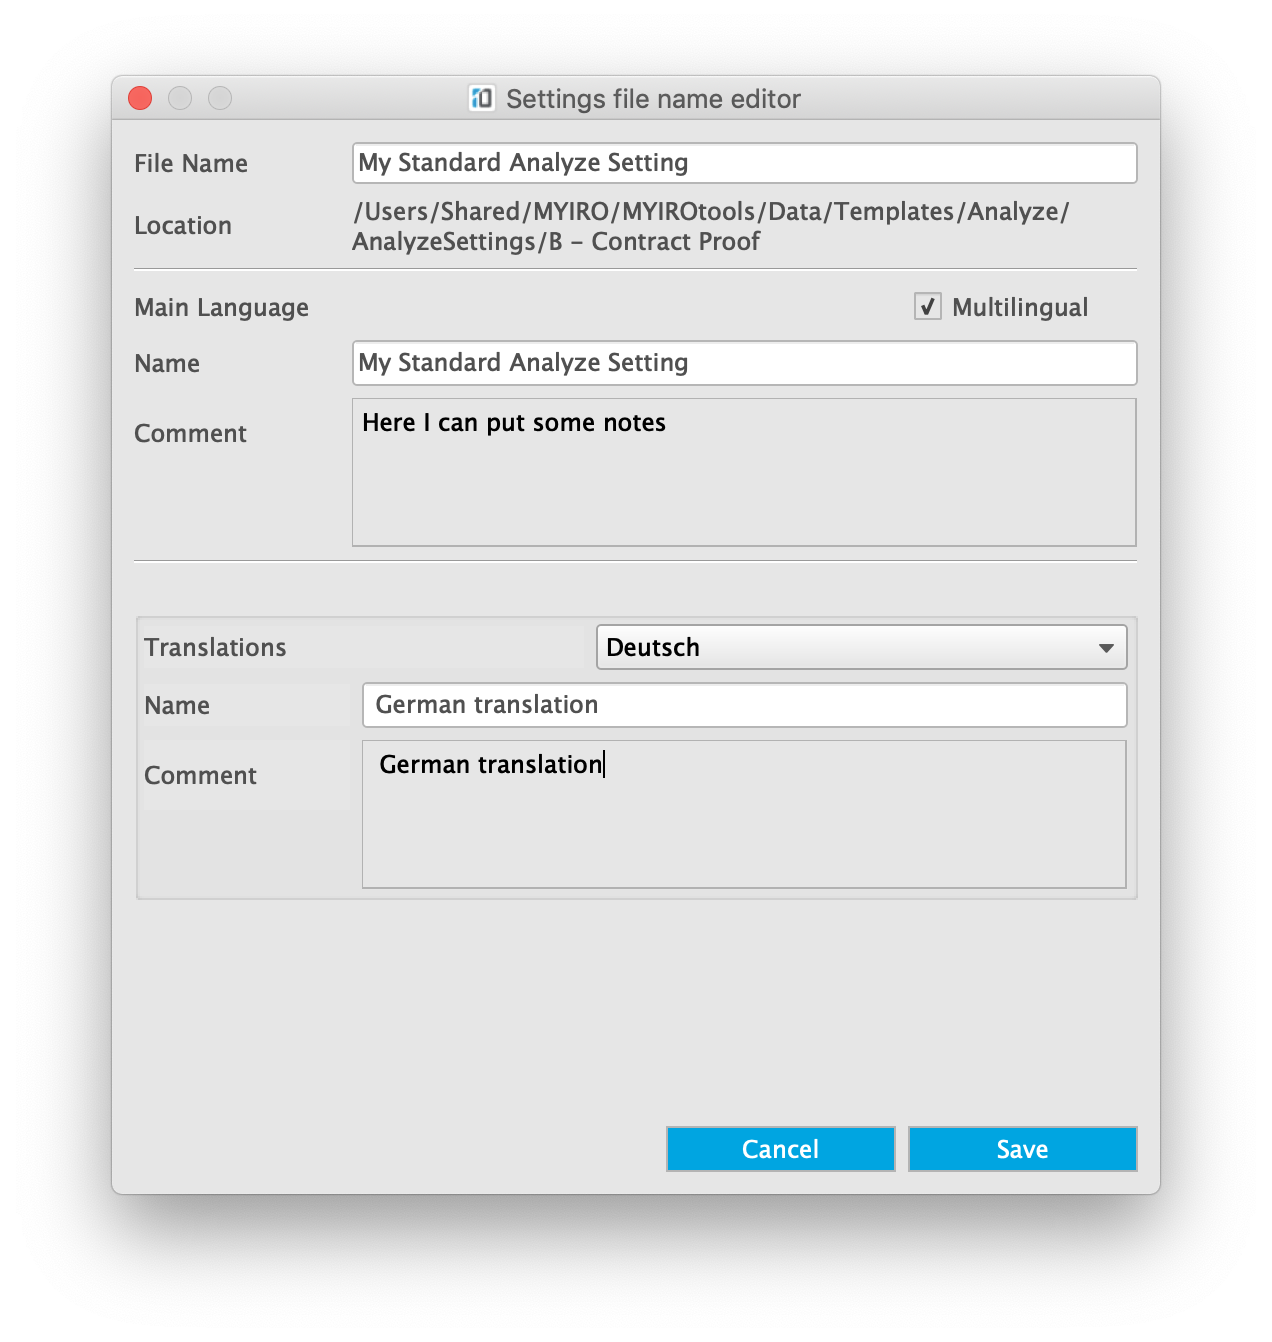
The "Save settings" dialogue allows you to specify the filename, the name of the setting for the user interface and to add comments. To translate the name and comments into other languages activate the checkbox "Multilingual".
After having selected such a customized Analyze Setting you can delete it using the "-" button.
The checkbox "Automatic calculation" is switched off when you open "Analyze".
To get the evaluation result you have to click "Calculate" or switch on "Automatic calculation".
It is advisable to leave it "off" when you analyze charts with many patches. Otherwise MYIROtools would calculate the result every time you adjust a parameter. For typical control wedges with 50-100 patches the calculation is fast and it is save to leave "Automatic calculation" switched on.
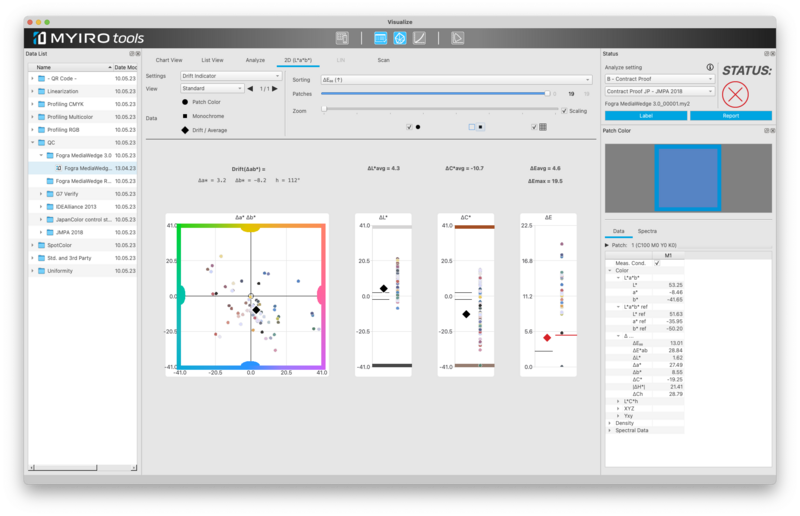
When you change to the tab "2D (Lab)" you can check the drift of the deviations in the drift indicator.
The mesurements are plotted into four diagrams:
Drift (∆ab*) shows the deviations between print and reference in the a*b*-plane.
The reference is the center.
It answers the question if your print has a colorcast compared to the reference.
Drift ∆L* shows the lightness deviations.
It answers the questions if your print is lighter or darker than the reference.
Drift ∆C* shows the chroma deviations.
It answers the question if your print is less or more vivid than the reference.
∆E shows the overall color difference in a plot.
